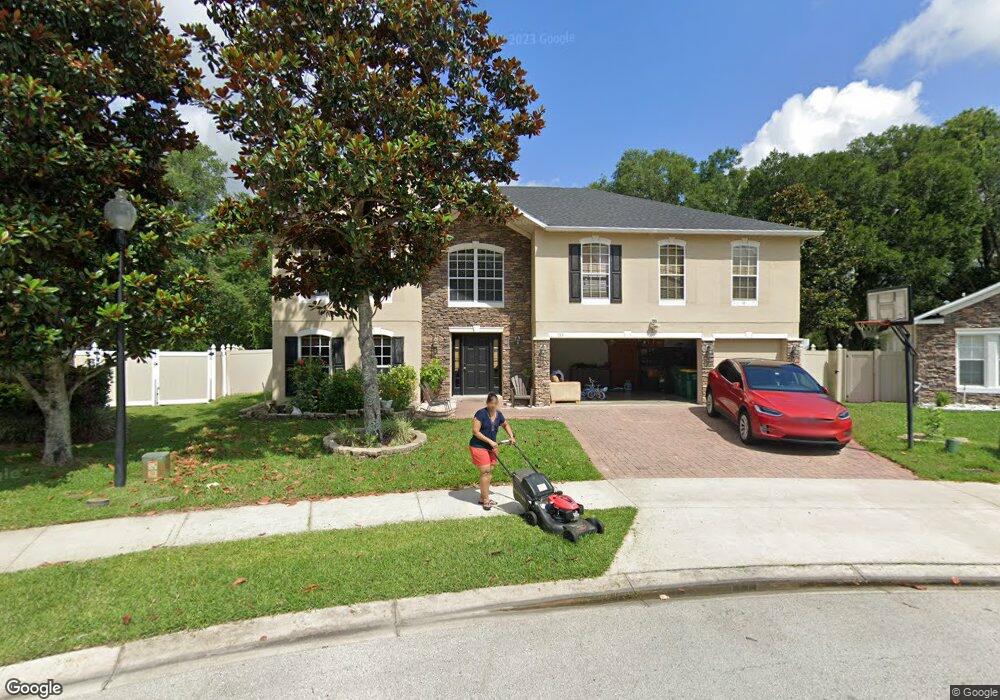
113 W Fiesta Key Loop Deland, FL 32720
Estimated Value: $523,380 - $632,000
6
Beds
5
Baths
4,524
Sq Ft
$125/Sq Ft
Est. Value
About This Home
This home is located at 113 W Fiesta Key Loop, Deland, FL 32720 and is currently estimated at $563,595, approximately $124 per square foot. 113 W Fiesta Key Loop is a home located in Volusia County with nearby schools including Citrus Grove Elementary, Deland High School, and Southwestern Middle School.
Ownership History
Date
Name
Owned For
Owner Type
Purchase Details
Closed on
Mar 30, 2017
Sold by
Pooler Michael and Pooler Erica
Bought by
Patel Himanshu and Patel Hemlatabahen
Current Estimated Value
Home Financials for this Owner
Home Financials are based on the most recent Mortgage that was taken out on this home.
Original Mortgage
$240,000
Outstanding Balance
$199,387
Interest Rate
4.15%
Mortgage Type
New Conventional
Estimated Equity
$364,208
Purchase Details
Closed on
Jun 29, 2007
Sold by
Maronda Homes Inc Of Florida
Bought by
Pooler Erica C and Pooler Michael J
Home Financials for this Owner
Home Financials are based on the most recent Mortgage that was taken out on this home.
Original Mortgage
$298,298
Interest Rate
6.35%
Mortgage Type
Purchase Money Mortgage
Create a Home Valuation Report for This Property
The Home Valuation Report is an in-depth analysis detailing your home's value as well as a comparison with similar homes in the area
Home Values in the Area
Average Home Value in this Area
Purchase History
| Date | Buyer | Sale Price | Title Company |
|---|---|---|---|
| Patel Himanshu | $300,000 | Perfect Title & Escrow Inc | |
| Pooler Erica C | $338,975 | Kampf Title & Guaranty Corp |
Source: Public Records
Mortgage History
| Date | Status | Borrower | Loan Amount |
|---|---|---|---|
| Open | Patel Himanshu | $240,000 | |
| Previous Owner | Pooler Erica C | $298,298 |
Source: Public Records
Tax History Compared to Growth
Tax History
| Year | Tax Paid | Tax Assessment Tax Assessment Total Assessment is a certain percentage of the fair market value that is determined by local assessors to be the total taxable value of land and additions on the property. | Land | Improvement |
|---|---|---|---|---|
| 2025 | $8,283 | $454,394 | $45,000 | $409,394 |
| 2024 | $7,677 | $453,672 | $45,000 | $408,672 |
| 2023 | $7,677 | $455,407 | $40,000 | $415,407 |
| 2022 | $6,949 | $385,769 | $40,000 | $345,769 |
| 2021 | $6,634 | $322,926 | $35,000 | $287,926 |
| 2020 | $6,385 | $309,843 | $30,000 | $279,843 |
| 2019 | $6,133 | $284,096 | $25,500 | $258,596 |
| 2018 | $5,917 | $262,858 | $18,000 | $244,858 |
| 2017 | $6,032 | $258,674 | $17,850 | $240,824 |
| 2016 | $6,090 | $265,125 | $0 | $0 |
| 2015 | $4,359 | $226,165 | $0 | $0 |
| 2014 | $4,417 | $224,370 | $0 | $0 |
Source: Public Records
Map
Nearby Homes
- 121 W Fiesta Key Loop
- 0 No Name St Unit 1121841
- 0 No Name Unit MFRNS1085318
- 0 No Name Unit MFRV4945833
- 0 No Name St Unit MFRV4945045
- 606 White Oak Way
- 603 Cypress Oak Cir
- 1130 River Falls Cir
- 700 Cypress Oak Cir
- 608 Cypress Oak Cir
- 320 Southern Winds Blvd
- 186 E Fiesta Key Loop
- 212 N Sheridan Ave
- 324 Alexandrite St
- 1701 Andover Ridge Dr
- 306 Alexandrite St
- 326 Alexandrite St
- 1697 Andover Ridge Dr
- 131 Addle Hill Ct
- 1655 Andover Ridge Dr
- 115 W Fiesta Key Loop
- 111 W Fiesta Key Loop
- 117 W Fiesta Key Loop
- 109 W Fiesta Key Loop
- 112 W Fiesta Key Loop
- 119 W Fiesta Key Loop
- 491 Hazen Rd
- 110 W Fiesta Key Loop
- 107 W Fiesta Key Loop
- 470 Hazen Rd
- 1570 W Minnesota Ave
- 1586 W Minnesota Ave
- 116 W Fiesta Key Loop
- 105 W Fiesta Key Loop
- 424 Hazen Rd
- 104 W Fiesta Key Loop
- 123 W Fiesta Key Loop
- 118 W Fiesta Key Loop
- 102 W Fiesta Key Loop
- 1608 W Minnesota Ave