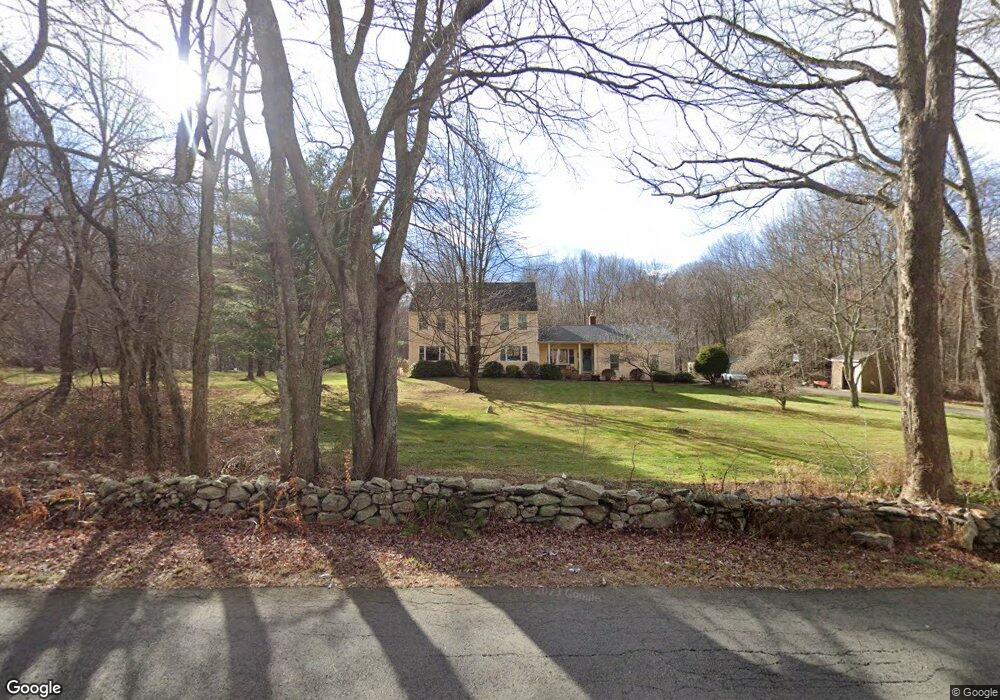
113 West St Columbia, CT 06237
Estimated Value: $459,000 - $551,000
3
Beds
2
Baths
2,032
Sq Ft
$249/Sq Ft
Est. Value
About This Home
This home is located at 113 West St, Columbia, CT 06237 and is currently estimated at $505,956, approximately $248 per square foot. 113 West St is a home located in Tolland County with nearby schools including Horace W. Porter School.
Ownership History
Date
Name
Owned For
Owner Type
Purchase Details
Closed on
Aug 19, 2010
Sold by
Santo Richard and Santo Tamara
Bought by
Tarbell Bryan and Tarbell Melinda
Current Estimated Value
Home Financials for this Owner
Home Financials are based on the most recent Mortgage that was taken out on this home.
Original Mortgage
$244,000
Outstanding Balance
$162,040
Interest Rate
4.63%
Estimated Equity
$343,916
Purchase Details
Closed on
Jun 1, 1998
Sold by
Kokubun Edwin and Kokubun Marilyn
Bought by
Santo Richard
Home Financials for this Owner
Home Financials are based on the most recent Mortgage that was taken out on this home.
Original Mortgage
$99,000
Interest Rate
7.12%
Create a Home Valuation Report for This Property
The Home Valuation Report is an in-depth analysis detailing your home's value as well as a comparison with similar homes in the area
Home Values in the Area
Average Home Value in this Area
Purchase History
| Date | Buyer | Sale Price | Title Company |
|---|---|---|---|
| Tarbell Bryan | $305,000 | -- | |
| Santo Richard | $199,000 | -- |
Source: Public Records
Mortgage History
| Date | Status | Borrower | Loan Amount |
|---|---|---|---|
| Open | Santo Richard | $244,000 | |
| Previous Owner | Santo Richard | $93,600 | |
| Previous Owner | Santo Richard | $99,000 | |
| Previous Owner | Santo Richard | $40,000 |
Source: Public Records
Tax History
| Year | Tax Paid | Tax Assessment Tax Assessment Total Assessment is a certain percentage of the fair market value that is determined by local assessors to be the total taxable value of land and additions on the property. | Land | Improvement |
|---|---|---|---|---|
| 2025 | $6,450 | $220,360 | $51,520 | $168,840 |
| 2024 | $6,197 | $220,360 | $51,520 | $168,840 |
| 2023 | $5,710 | $220,360 | $51,520 | $168,840 |
| 2022 | $5,701 | $220,360 | $51,520 | $168,840 |
| 2021 | $17,275 | $191,400 | $51,800 | $139,600 |
| 2020 | $5,614 | $191,400 | $51,800 | $139,600 |
| 2019 | $5,614 | $191,400 | $51,800 | $139,600 |
| 2018 | $4,966 | $191,400 | $51,800 | $139,600 |
| 2017 | $5,937 | $191,400 | $51,800 | $139,600 |
| 2016 | $5,194 | $189,300 | $51,800 | $137,500 |
| 2015 | $5,136 | $189,300 | $51,800 | $137,500 |
| 2014 | $5,136 | $189,300 | $51,800 | $137,500 |
Source: Public Records
Map
Nearby Homes
Your Personal Tour Guide
Ask me questions while you tour the home.