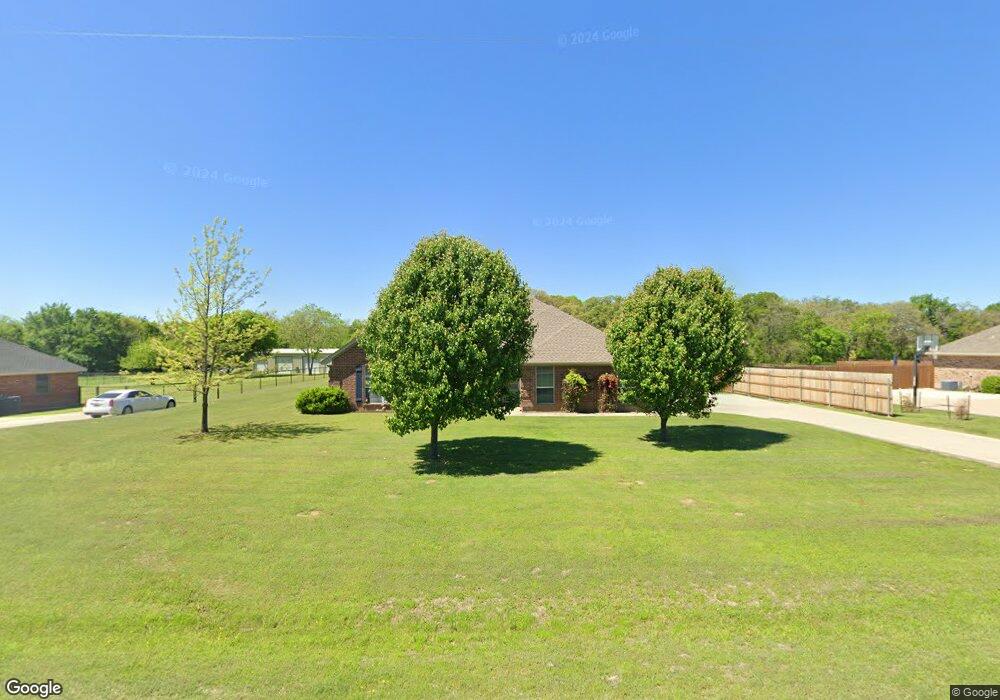
113 Westend Ln Weatherford, TX 76088
Estimated Value: $379,107 - $446,000
4
Beds
2
Baths
1,670
Sq Ft
$239/Sq Ft
Est. Value
About This Home
This home is located at 113 Westend Ln, Weatherford, TX 76088 and is currently estimated at $399,027, approximately $238 per square foot. 113 Westend Ln is a home located in Parker County with nearby schools including Wright Elementary School, Hall Middle School, and Weatherford High School.
Ownership History
Date
Name
Owned For
Owner Type
Purchase Details
Closed on
Jul 29, 2011
Sold by
Federal National Mortgage Association
Bought by
Schabow Whitney L
Current Estimated Value
Home Financials for this Owner
Home Financials are based on the most recent Mortgage that was taken out on this home.
Original Mortgage
$123,626
Outstanding Balance
$85,397
Interest Rate
4.52%
Mortgage Type
New Conventional
Estimated Equity
$313,630
Purchase Details
Closed on
May 24, 2011
Sold by
Aurora Loan Services Llc
Bought by
Schabow Whitney L
Purchase Details
Closed on
May 3, 2011
Sold by
Hull Floyd
Bought by
Schabow Whitney L
Purchase Details
Closed on
Jan 5, 2006
Sold by
Topline Custom Contracting Inc
Bought by
Schabow Whitney L
Home Financials for this Owner
Home Financials are based on the most recent Mortgage that was taken out on this home.
Original Mortgage
$122,800
Interest Rate
6.2%
Mortgage Type
Purchase Money Mortgage
Create a Home Valuation Report for This Property
The Home Valuation Report is an in-depth analysis detailing your home's value as well as a comparison with similar homes in the area
Home Values in the Area
Average Home Value in this Area
Purchase History
| Date | Buyer | Sale Price | Title Company |
|---|---|---|---|
| Schabow Whitney L | -- | -- | |
| Mooney Whitney L | -- | Excel Title | |
| Schabow Whitney L | -- | -- | |
| Federal National Mortgage Association | -- | None Available | |
| Schabow Whitney L | -- | -- | |
| Aurora Loan Services Llc | $130,406 | None Available | |
| Schabow Whitney L | -- | -- | |
| Hull Floyd | -- | Stnt |
Source: Public Records
Mortgage History
| Date | Status | Borrower | Loan Amount |
|---|---|---|---|
| Open | Mooney Whitney L | $123,626 | |
| Previous Owner | Hull Floyd | $122,800 |
Source: Public Records
Tax History Compared to Growth
Tax History
| Year | Tax Paid | Tax Assessment Tax Assessment Total Assessment is a certain percentage of the fair market value that is determined by local assessors to be the total taxable value of land and additions on the property. | Land | Improvement |
|---|---|---|---|---|
| 2025 | $4,096 | $346,738 | -- | -- |
| 2024 | $4,096 | $315,216 | -- | -- |
| 2023 | $4,096 | $286,560 | $0 | $0 |
| 2022 | $4,850 | $289,340 | $50,000 | $239,340 |
| 2021 | $4,781 | $289,340 | $50,000 | $239,340 |
| 2020 | $4,367 | $249,680 | $25,000 | $224,680 |
| 2019 | $4,235 | $249,680 | $25,000 | $224,680 |
| 2018 | $3,354 | $154,210 | $25,000 | $129,210 |
| 2017 | $3,224 | $154,210 | $25,000 | $129,210 |
| 2016 | $2,931 | $132,060 | $25,000 | $107,060 |
| 2015 | $2,523 | $132,060 | $25,000 | $107,060 |
| 2014 | $2,320 | $114,560 | $25,000 | $89,560 |
Source: Public Records
Map
Nearby Homes
- 1930 Old Mineral Wells Hwy
- 1882 Old Mineral Wells Hwy
- 1520 Vine St
- 1442 W Water St
- 2435 Old Mineral Wells Hwy
- 1802 Greenwood Rd
- 109 Garner Rd
- 1401 W Ball St
- 1402 W Water St
- 1318 W Water St
- 1008 Salvation Dr
- TBD Forest Ln
- 115 Harmon St
- 1701 Ranger Hwy
- 217 Clinton Dr
- 145 Redbud Ln
- 302 Case St
- 1741 Ranger Hwy
- 506 Chilton St
- 167 Duke Trail
- 117 Westend Ln
- 109 Westend Ln
- 114 Westend Ln
- 121 Westend Ln
- 118 Westend Ln
- 105 Westend Ln
- 122 Westend Ln
- 125 Westend Ln
- 126 Westend Ln
- 101 Westend Ln
- 2010 Old Mineral Wells Hwy
- 130 Westend Ln
- 129 Westend Ln
- 133 Westend Ln
- 132 Westend Ln
- 136 Westend Ln
- 137 Westend Ln
- 2115 Old Mineral Wells Hwy
- 2121 Old Mineral Wells Hwy
- 140 Westend Ln