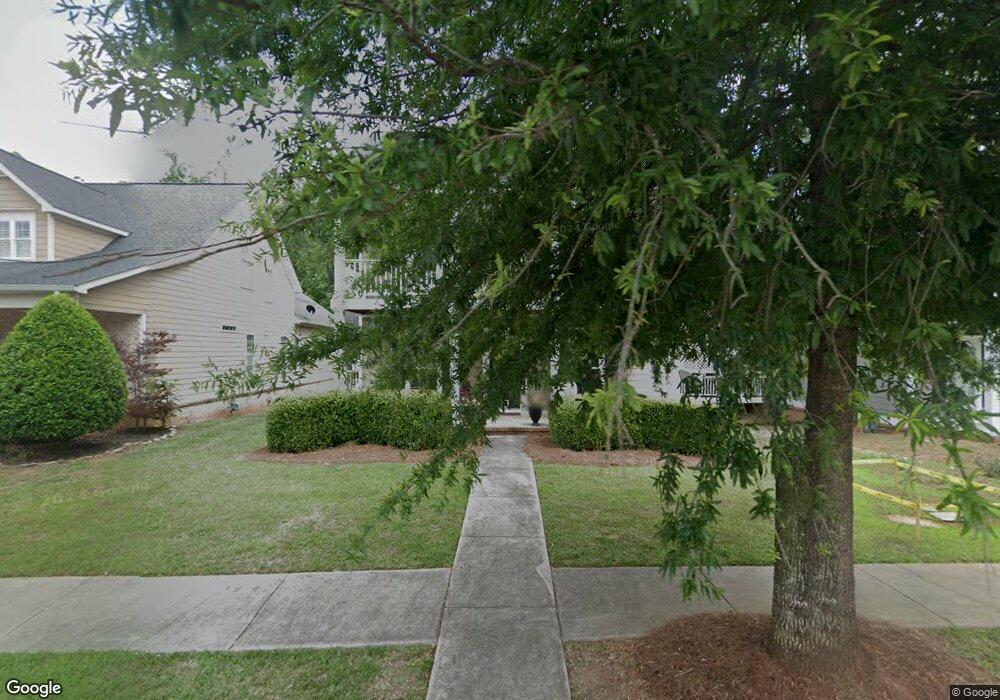
113 Whistler Ln Macon, GA 31210
Estimated Value: $344,000 - $387,000
3
Beds
3
Baths
2,477
Sq Ft
$146/Sq Ft
Est. Value
About This Home
This home is located at 113 Whistler Ln, Macon, GA 31210 and is currently estimated at $361,559, approximately $145 per square foot. 113 Whistler Ln is a home located in Bibb County with nearby schools including Springdale Elementary School, Howard Middle School, and Howard High School.
Ownership History
Date
Name
Owned For
Owner Type
Purchase Details
Closed on
Jun 16, 2015
Sold by
Morang Mark K and Morang Rosemary A
Bought by
Baldwin Brooke Llc
Current Estimated Value
Purchase Details
Closed on
Oct 25, 2013
Sold by
Certsbank Na
Bought by
Baldwin Brooke Llc
Purchase Details
Closed on
May 29, 2009
Sold by
M L Casteel Inc
Bought by
Baldwin Brooke Llc
Purchase Details
Closed on
Aug 21, 2007
Bought by
Casteel M L
Create a Home Valuation Report for This Property
The Home Valuation Report is an in-depth analysis detailing your home's value as well as a comparison with similar homes in the area
Home Values in the Area
Average Home Value in this Area
Purchase History
| Date | Buyer | Sale Price | Title Company |
|---|---|---|---|
| Baldwin Brooke Llc | $22,500 | None Available | |
| Moring Mark K | $225,000 | None Available | |
| Baldwin Brooke Llc | -- | None Available | |
| Baldwin Brooke Llc | -- | None Available | |
| Casteel M L | $122,400 | -- |
Source: Public Records
Tax History Compared to Growth
Tax History
| Year | Tax Paid | Tax Assessment Tax Assessment Total Assessment is a certain percentage of the fair market value that is determined by local assessors to be the total taxable value of land and additions on the property. | Land | Improvement |
|---|---|---|---|---|
| 2025 | $3,494 | $149,192 | $18,000 | $131,192 |
| 2024 | $3,611 | $149,192 | $18,000 | $131,192 |
| 2023 | $2,745 | $133,081 | $18,000 | $115,081 |
| 2022 | $4,252 | $129,817 | $13,860 | $115,957 |
| 2021 | $3,808 | $107,217 | $12,600 | $94,617 |
| 2020 | $3,891 | $107,217 | $12,600 | $94,617 |
| 2019 | $3,782 | $103,613 | $12,600 | $91,013 |
| 2018 | $6,392 | $103,613 | $12,600 | $91,013 |
| 2017 | $3,679 | $98,206 | $12,600 | $85,606 |
| 2016 | $3,114 | $93,701 | $12,600 | $81,101 |
| 2015 | $4,589 | $93,701 | $12,600 | $81,101 |
| 2014 | -- | $93,701 | $12,600 | $81,101 |
Source: Public Records
Map
Nearby Homes
- 109 Whistler Ln
- 115 Whistler Ln
- 117 Whistler Ln
- 105 Whistler Ln
- 119 Whistler Ln
- 103 Whistler Ln
- 121 Whistler Ln
- 112 Whistler Ln
- 108 Whistler Ln
- 352 Providence Blvd
- 114 Whistler Ln
- 101 Whistler Ln
- 344 Providence Blvd
- 116 Whistler Ln
- 356 Providence Blvd
- 358 Providence Blvd
- 118 Whistler Ln
- 340 Providence Blvd
- 122 Whistler Ln
- 360 Providence Blvd