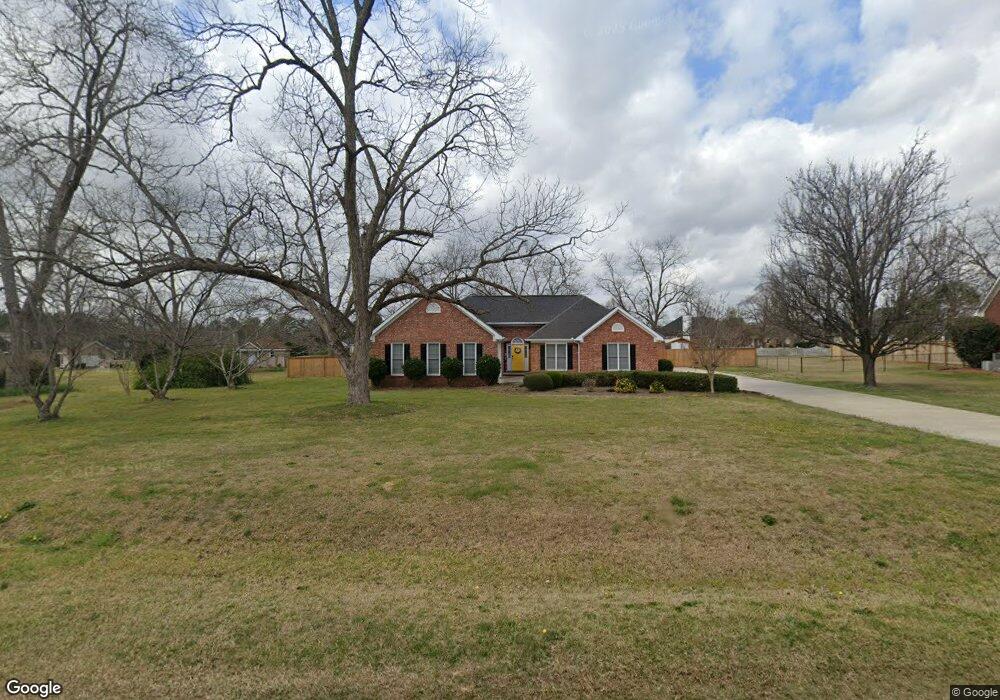
113 William Way Macon, GA 31216
Estimated Value: $309,522 - $350,000
4
Beds
3
Baths
2,459
Sq Ft
$132/Sq Ft
Est. Value
About This Home
This home is located at 113 William Way, Macon, GA 31216 and is currently estimated at $323,631, approximately $131 per square foot. 113 William Way is a home located in Bibb County with nearby schools including Porter Elementary School, Rutland Middle School, and Rutland High School.
Ownership History
Date
Name
Owned For
Owner Type
Purchase Details
Closed on
Feb 28, 2020
Sold by
Barfield Michael S
Bought by
Colbert Travis S and Colbert Taqueicia J
Current Estimated Value
Home Financials for this Owner
Home Financials are based on the most recent Mortgage that was taken out on this home.
Original Mortgage
$220,924
Outstanding Balance
$195,195
Interest Rate
3.6%
Mortgage Type
FHA
Estimated Equity
$128,436
Purchase Details
Closed on
Jun 17, 2019
Sold by
Grubbs Wanda Ezell
Bought by
Barfield Michael S
Home Financials for this Owner
Home Financials are based on the most recent Mortgage that was taken out on this home.
Original Mortgage
$146,000
Interest Rate
4.1%
Mortgage Type
Future Advance Clause Open End Mortgage
Purchase Details
Closed on
Mar 22, 2018
Sold by
Grubbs Wanda Ezel
Bought by
Grubbs Wanda Ezell
Purchase Details
Closed on
Mar 8, 1994
Sold by
Pecan Acres Inc
Bought by
Grubbs Quinton and Grubbs Wanda E
Create a Home Valuation Report for This Property
The Home Valuation Report is an in-depth analysis detailing your home's value as well as a comparison with similar homes in the area
Home Values in the Area
Average Home Value in this Area
Purchase History
| Date | Buyer | Sale Price | Title Company |
|---|---|---|---|
| Colbert Travis S | $225,000 | None Available | |
| Barfield Michael S | $184,000 | None Available | |
| Grubbs Wanda Ezell | -- | None Available | |
| Grubbs Quinton | $18,500 | -- |
Source: Public Records
Mortgage History
| Date | Status | Borrower | Loan Amount |
|---|---|---|---|
| Open | Colbert Travis S | $220,924 | |
| Previous Owner | Barfield Michael S | $146,000 |
Source: Public Records
Tax History Compared to Growth
Tax History
| Year | Tax Paid | Tax Assessment Tax Assessment Total Assessment is a certain percentage of the fair market value that is determined by local assessors to be the total taxable value of land and additions on the property. | Land | Improvement |
|---|---|---|---|---|
| 2025 | $2,986 | $121,512 | $12,000 | $109,512 |
| 2024 | $3,067 | $120,768 | $12,000 | $108,768 |
| 2023 | $2,829 | $111,403 | $10,000 | $101,403 |
| 2022 | $3,555 | $102,683 | $10,000 | $92,683 |
| 2021 | $3,171 | $83,448 | $10,000 | $73,448 |
| 2020 | $2,857 | $83,448 | $10,000 | $73,448 |
| 2019 | $2,723 | $83,448 | $10,000 | $73,448 |
| 2018 | $4,057 | $78,569 | $10,000 | $68,569 |
| 2017 | $2,681 | $78,569 | $10,000 | $68,569 |
| 2016 | $2,476 | $78,569 | $10,000 | $68,569 |
| 2015 | $3,505 | $78,569 | $10,000 | $68,569 |
| 2014 | $1,170 | $78,569 | $10,000 | $68,569 |
Source: Public Records
Map
Nearby Homes