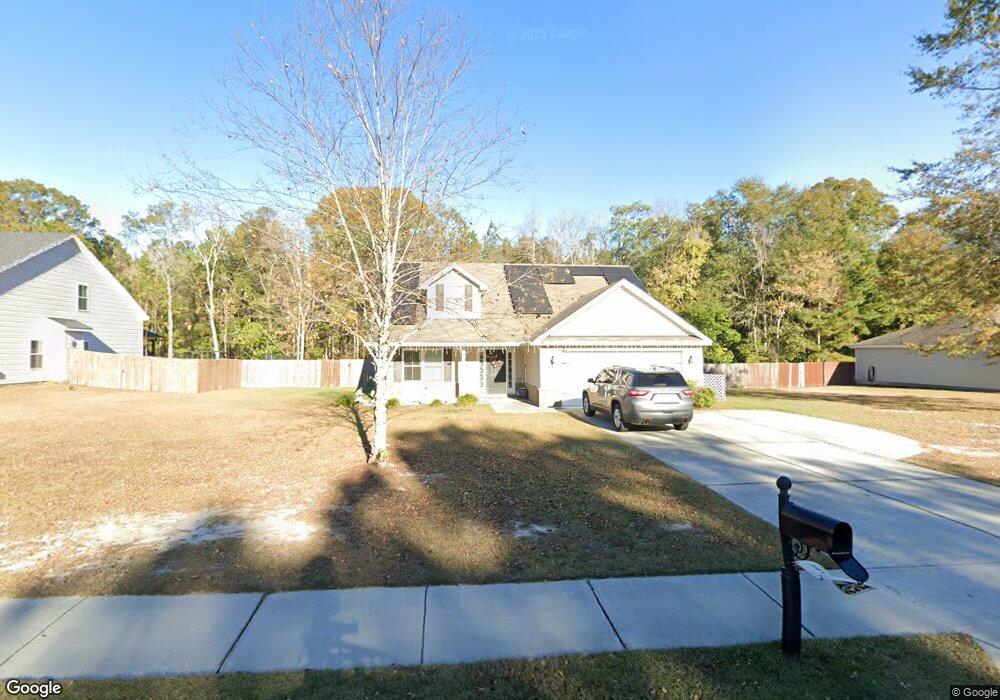
113 William Way Springfield, GA 31329
Estimated Value: $343,440 - $410,000
4
Beds
3
Baths
2,271
Sq Ft
$166/Sq Ft
Est. Value
About This Home
This home is located at 113 William Way, Springfield, GA 31329 and is currently estimated at $377,860, approximately $166 per square foot. 113 William Way is a home located in Effingham County with nearby schools including Springfield Elementary School, Effingham County Middle School, and Effingham County High School.
Ownership History
Date
Name
Owned For
Owner Type
Purchase Details
Closed on
Aug 26, 2015
Sold by
Horizon Home Builders Of S
Bought by
Nicolaus Wayne L and Nicolaus Melissa L
Current Estimated Value
Home Financials for this Owner
Home Financials are based on the most recent Mortgage that was taken out on this home.
Original Mortgage
$186,755
Outstanding Balance
$146,027
Interest Rate
4.02%
Mortgage Type
VA
Estimated Equity
$231,833
Purchase Details
Closed on
Sep 8, 2014
Sold by
Beaubrook Investors Llc
Bought by
Horizon Home Builders Of Savan
Purchase Details
Closed on
Jun 18, 2013
Sold by
Heritagebank Of The South
Bought by
Beaubrook Investors Llc
Purchase Details
Closed on
Dec 22, 2012
Sold by
Heritagebank Of The South
Bought by
Heritagebank Of The South
Purchase Details
Closed on
Mar 6, 2007
Bought by
Jlh Development Inc
Create a Home Valuation Report for This Property
The Home Valuation Report is an in-depth analysis detailing your home's value as well as a comparison with similar homes in the area
Home Values in the Area
Average Home Value in this Area
Purchase History
| Date | Buyer | Sale Price | Title Company |
|---|---|---|---|
| Nicolaus Wayne L | $182,825 | -- | |
| Horizon Home Builders Of Savan | $17,000 | -- | |
| Beaubrook Investors Llc | $375,000 | -- | |
| Heritagebank Of The South | -- | -- | |
| Jlh Development Inc | -- | -- |
Source: Public Records
Mortgage History
| Date | Status | Borrower | Loan Amount |
|---|---|---|---|
| Open | Nicolaus Wayne L | $186,755 |
Source: Public Records
Tax History
| Year | Tax Paid | Tax Assessment Tax Assessment Total Assessment is a certain percentage of the fair market value that is determined by local assessors to be the total taxable value of land and additions on the property. | Land | Improvement |
|---|---|---|---|---|
| 2025 | $4,843 | $133,826 | $22,800 | $111,026 |
| 2024 | $4,843 | $137,396 | $22,800 | $114,596 |
| 2023 | $3,877 | $119,741 | $17,600 | $102,141 |
| 2022 | $3,496 | $98,749 | $16,000 | $82,749 |
| 2021 | $2,872 | $79,435 | $14,000 | $65,435 |
| 2020 | $2,778 | $80,348 | $12,000 | $68,348 |
| 2019 | $2,458 | $72,032 | $10,000 | $62,032 |
| 2018 | $2,467 | $72,287 | $8,800 | $63,487 |
| 2017 | $2,488 | $72,287 | $8,800 | $63,487 |
| 2016 | $2,511 | $73,300 | $7,920 | $65,380 |
| 2015 | -- | $71,780 | $6,400 | $65,380 |
| 2014 | -- | $6,400 | $6,400 | $0 |
| 2013 | -- | $6,000 | $6,000 | $0 |
Source: Public Records
Map
Nearby Homes
- 204 Beaubrook Blvd
- 118 William Way
- 1030 Georgia 119
- 0 Pleasant Acres Rd
- 678 W 3rd St
- 194 Deerfield Dr
- 0 Hwy 21 N Unit 329376
- 0 Highway 21 N Unit SA349590
- 0 Georgia 21 Unit C
- 0 Georgia 21 Unit B
- 0 Hwy 21 N Unit SA342214
- 118 Bridgewood Dr
- 112 Bridgewood Dr
- 313 Hickory St
- 110 Freesia Dr
- 0 Old Tusculum Rd Unit 10578489
- 0 Old Tusculum Rd Unit SA335776
- 137 Rose Dr
- 114 Rose Dr
- 0 W Madison St
- 115 William Way
- 110 William Way
- 108 William Way
- 117 William Way
- 0 William Way Lot # 52 Unit 107633
- 0 William Way Lot # 51 Unit 107630
- 0 William Way Lot # 50 Unit 107626
- 0 William Way Lot # 55 Unit 107638
- 0 William Way Lot # 54 Unit 107636
- 0 William Way Lot # 53 Unit 107635
- 0 William Way Lot # 80 Unit 107660
- 0 William Way Lot # 79 Unit 107659
- 0 William Way Lot # 78 Unit 107658
- 111 William Way
- 106 William Way
- 102 William Way
- 109 William Way
- 112 William Way
- 119 William Way
- 207 Beaubrook Blvd
Your Personal Tour Guide
Ask me questions while you tour the home.