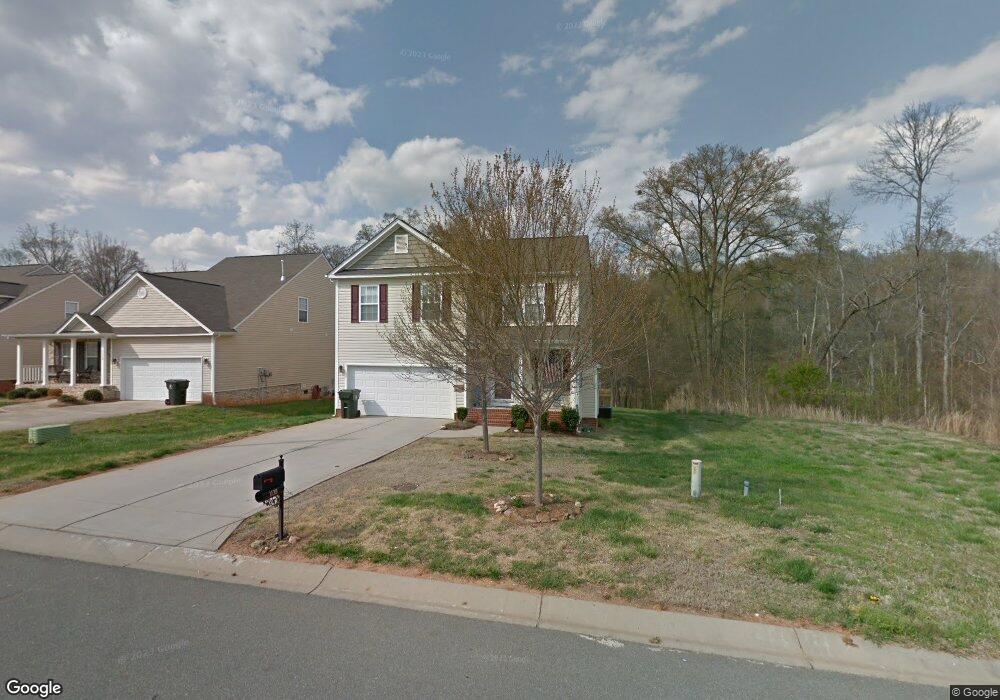
1130 Catawba Run Lowell, NC 28098
Estimated Value: $340,000 - $368,000
4
Beds
3
Baths
1,800
Sq Ft
$194/Sq Ft
Est. Value
About This Home
This home is located at 1130 Catawba Run, Lowell, NC 28098 and is currently estimated at $350,043, approximately $194 per square foot. 1130 Catawba Run is a home located in Gaston County with nearby schools including Lowell Elementary School, Holbrook Middle School, and Ashbrook High School.
Ownership History
Date
Name
Owned For
Owner Type
Purchase Details
Closed on
Jan 26, 2010
Sold by
Fannie Mae
Bought by
Lamb Norris
Current Estimated Value
Home Financials for this Owner
Home Financials are based on the most recent Mortgage that was taken out on this home.
Original Mortgage
$142,907
Outstanding Balance
$94,296
Interest Rate
4.97%
Mortgage Type
VA
Estimated Equity
$255,747
Purchase Details
Closed on
Oct 25, 2009
Sold by
Burrell Carleton and Burrell Carleton L
Bought by
Federal National Mortgage Association
Purchase Details
Closed on
Feb 14, 2008
Sold by
Beazer Homes Corp
Bought by
Burrell Carleton L and Burrell Carleton
Home Financials for this Owner
Home Financials are based on the most recent Mortgage that was taken out on this home.
Original Mortgage
$161,405
Interest Rate
6.06%
Mortgage Type
Purchase Money Mortgage
Purchase Details
Closed on
Mar 12, 2007
Sold by
Craft Development Llc
Bought by
Beazer Homes Corp
Purchase Details
Closed on
Sep 29, 2005
Sold by
Craft Development Llc
Bought by
Beazer Homes Corp
Create a Home Valuation Report for This Property
The Home Valuation Report is an in-depth analysis detailing your home's value as well as a comparison with similar homes in the area
Home Values in the Area
Average Home Value in this Area
Purchase History
| Date | Buyer | Sale Price | Title Company |
|---|---|---|---|
| Lamb Norris | -- | None Available | |
| Federal National Mortgage Association | $134,978 | None Available | |
| Burrell Carleton L | $170,000 | Investors Title | |
| Beazer Homes Corp | $232,000 | None Available | |
| Beazer Homes Corp | $324,000 | -- |
Source: Public Records
Mortgage History
| Date | Status | Borrower | Loan Amount |
|---|---|---|---|
| Open | Lamb Norris | $142,907 | |
| Previous Owner | Burrell Carleton L | $161,405 |
Source: Public Records
Tax History Compared to Growth
Tax History
| Year | Tax Paid | Tax Assessment Tax Assessment Total Assessment is a certain percentage of the fair market value that is determined by local assessors to be the total taxable value of land and additions on the property. | Land | Improvement |
|---|---|---|---|---|
| 2025 | $3,462 | $323,820 | $25,200 | $298,620 |
| 2024 | $3,462 | $323,820 | $25,200 | $298,620 |
| 2023 | $3,837 | $326,620 | $28,000 | $298,620 |
| 2022 | $2,789 | $197,810 | $21,000 | $176,810 |
| 2021 | $2,611 | $197,810 | $21,000 | $176,810 |
| 2020 | $2,492 | $197,810 | $21,000 | $176,810 |
| 2019 | $2,512 | $197,810 | $21,000 | $176,810 |
| 2018 | $1,805 | $138,874 | $19,200 | $119,674 |
| 2017 | $1,805 | $138,874 | $19,200 | $119,674 |
| 2016 | $1,805 | $138,874 | $0 | $0 |
| 2014 | $2,097 | $161,332 | $26,000 | $135,332 |
Source: Public Records
Map
Nearby Homes
- 1409 River Run Rd
- 811 River Trail Rd
- 7017 Whitewater Loop
- 5021 Meadow Woods Dr
- 1402 Richmond Dr Unit 1
- 1319 N Main St
- 1023 Preston Dr Unit 54p
- Jasper Plan at Lowell Woods
- TA3000 Plan at Lowell Woods
- Kipling Plan at Lowell Woods
- Shepherd Plan at Lowell Woods
- Riley Plan at Lowell Woods
- Devin Plan at Lowell Woods
- Declan Plan at Lowell Woods
- Reeves Plan at Lowell Woods
- Winslow Plan at Lowell Woods
- Gideon Plan at Lowell Woods
- 1009 Preston Dr
- 1028 Preston Dr Unit 49p
- 1131 Alyssa Oaks Dr
- 1132 Catawba Run
- 1128 Catawba Run
- 1134 Catawba Run
- 1136 Catawba Run
- 728 Overlook Rd
- 729 Overlook Rd
- 1138 Catawba Run
- 726 Overlook Rd
- 727 Overlook Rd
- 929 River Trail Rd
- 0 River Crest Ct 1009 Unit 3946703-5969608
- 1140 Catawba Run
- 1430 River Run Rd
- 724 Overlook Rd
- 725 Overlook Rd
- 927 River Trail Rd
- 1428 River Run Rd
- 925 River Trail Rd
- 722 Overlook Rd
- 723 Overlook Rd