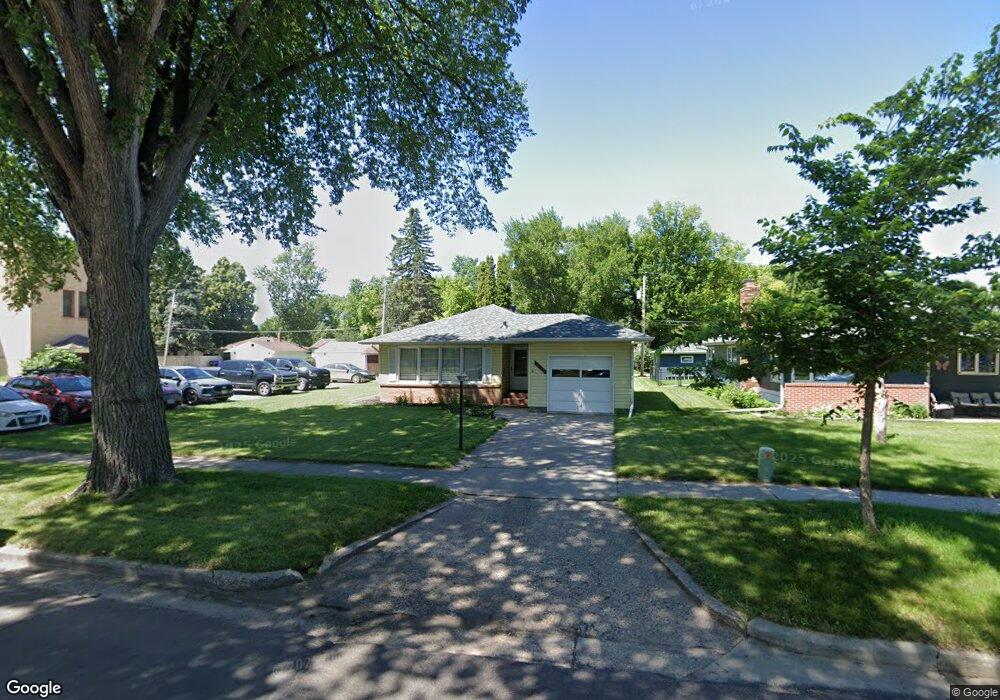
1130 Elm St N Fargo, ND 58102
Horace Mann NeighborhoodEstimated Value: $231,000 - $265,026
3
Beds
1
Bath
2,442
Sq Ft
$103/Sq Ft
Est. Value
About This Home
This home is located at 1130 Elm St N, Fargo, ND 58102 and is currently estimated at $250,757, approximately $102 per square foot. 1130 Elm St N is a home located in Cass County with nearby schools including Horace Mann Roosevelt Elementary School, Ben Franklin Middle School, and North High School.
Ownership History
Date
Name
Owned For
Owner Type
Purchase Details
Closed on
Aug 21, 2020
Sold by
Weber Dale
Bought by
Smith Austin S and Smith Richard L
Current Estimated Value
Home Financials for this Owner
Home Financials are based on the most recent Mortgage that was taken out on this home.
Original Mortgage
$168,300
Outstanding Balance
$149,294
Interest Rate
3%
Mortgage Type
New Conventional
Estimated Equity
$101,463
Purchase Details
Closed on
Oct 19, 2012
Sold by
Solberg Mary M
Bought by
Weber Allen
Purchase Details
Closed on
Dec 19, 2005
Sold by
First Interstate Bank Of Fargo Na
Bought by
Solberg Mary M
Create a Home Valuation Report for This Property
The Home Valuation Report is an in-depth analysis detailing your home's value as well as a comparison with similar homes in the area
Home Values in the Area
Average Home Value in this Area
Purchase History
| Date | Buyer | Sale Price | Title Company |
|---|---|---|---|
| Smith Austin S | $187,000 | The Titleco | |
| Weber Dale | $115,000 | Title Company Residential | |
| Weber Allen | $115,000 | None Available | |
| Solberg Mary M | -- | -- |
Source: Public Records
Mortgage History
| Date | Status | Borrower | Loan Amount |
|---|---|---|---|
| Open | Smith Austin S | $168,300 |
Source: Public Records
Tax History Compared to Growth
Tax History
| Year | Tax Paid | Tax Assessment Tax Assessment Total Assessment is a certain percentage of the fair market value that is determined by local assessors to be the total taxable value of land and additions on the property. | Land | Improvement |
|---|---|---|---|---|
| 2024 | $2,895 | $126,500 | $19,200 | $107,300 |
| 2023 | $2,989 | $111,950 | $19,200 | $92,750 |
| 2022 | $2,893 | $106,600 | $19,200 | $87,400 |
| 2021 | $2,582 | $96,900 | $19,200 | $77,700 |
| 2020 | $2,427 | $92,300 | $19,200 | $73,100 |
| 2019 | $2,429 | $92,300 | $11,400 | $80,900 |
| 2018 | $2,238 | $86,150 | $11,400 | $74,750 |
| 2017 | $2,108 | $82,050 | $11,400 | $70,650 |
| 2016 | $1,877 | $79,650 | $11,400 | $68,250 |
| 2015 | $1,747 | $69,500 | $7,800 | $61,700 |
| 2014 | $1,659 | $64,350 | $7,800 | $56,550 |
| 2013 | $1,581 | $61,300 | $7,800 | $53,500 |
Source: Public Records
Map
Nearby Homes