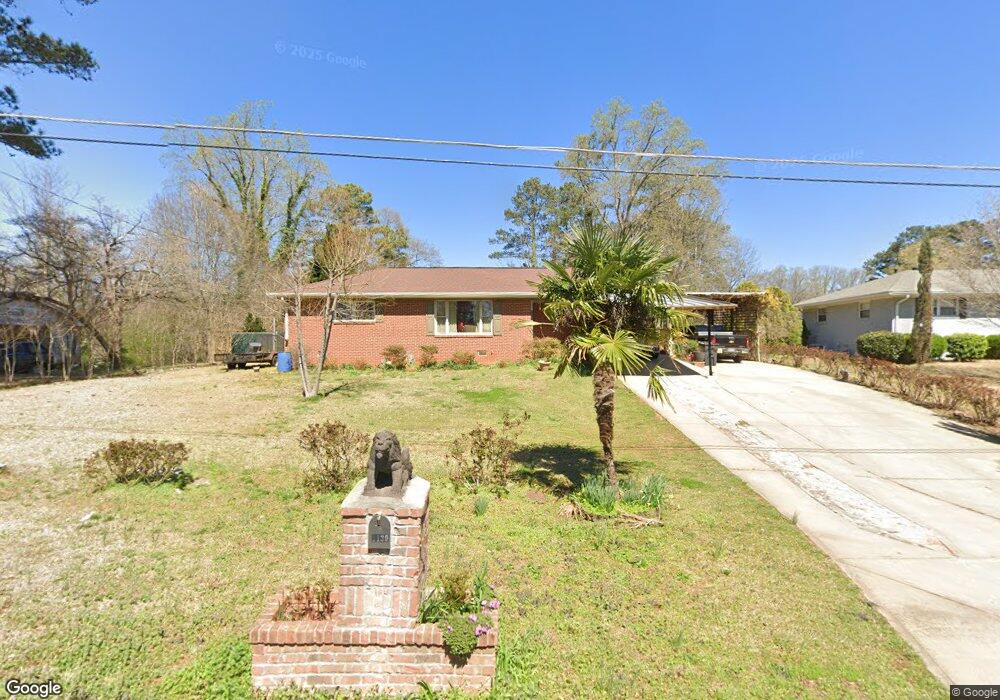
1130 Grace St SW Mableton, GA 30126
Estimated Value: $273,755 - $305,000
4
Beds
2
Baths
1,385
Sq Ft
$204/Sq Ft
Est. Value
About This Home
This home is located at 1130 Grace St SW, Mableton, GA 30126 and is currently estimated at $282,939, approximately $204 per square foot. 1130 Grace St SW is a home located in Cobb County with nearby schools including Deerwood Elementary School, Mableton Elementary School, and Floyd Middle School.
Ownership History
Date
Name
Owned For
Owner Type
Purchase Details
Closed on
Dec 8, 2010
Sold by
Cwabs Inc Series 2006-Bc3
Bought by
Gonzalez Moises A
Current Estimated Value
Purchase Details
Closed on
Apr 6, 2010
Sold by
Knighten Earl
Bought by
Cwabs Inc Series 2006-Bc3
Purchase Details
Closed on
Mar 9, 1999
Sold by
Laporte John M and Laporte Roslyn H
Bought by
Rivera Rogelio
Home Financials for this Owner
Home Financials are based on the most recent Mortgage that was taken out on this home.
Original Mortgage
$68,000
Interest Rate
7.06%
Mortgage Type
New Conventional
Purchase Details
Closed on
Sep 29, 1995
Sold by
Smith Gil and Winn Richard
Bought by
Laporte John M Roslyn H
Create a Home Valuation Report for This Property
The Home Valuation Report is an in-depth analysis detailing your home's value as well as a comparison with similar homes in the area
Home Values in the Area
Average Home Value in this Area
Purchase History
| Date | Buyer | Sale Price | Title Company |
|---|---|---|---|
| Gonzalez Moises A | $24,000 | -- | |
| Cwabs Inc Series 2006-Bc3 | $40,500 | -- | |
| Rivera Rogelio | $80,000 | -- | |
| Laporte John M Roslyn H | $57,000 | -- |
Source: Public Records
Mortgage History
| Date | Status | Borrower | Loan Amount |
|---|---|---|---|
| Previous Owner | Rivera Rogelio | $68,000 | |
| Closed | Laporte John M Roslyn H | $0 |
Source: Public Records
Tax History Compared to Growth
Tax History
| Year | Tax Paid | Tax Assessment Tax Assessment Total Assessment is a certain percentage of the fair market value that is determined by local assessors to be the total taxable value of land and additions on the property. | Land | Improvement |
|---|---|---|---|---|
| 2025 | $2,194 | $97,696 | $18,000 | $79,696 |
| 2024 | $2,196 | $97,696 | $18,000 | $79,696 |
| 2023 | $1,653 | $97,696 | $18,000 | $79,696 |
| 2022 | $1,129 | $48,176 | $10,000 | $38,176 |
| 2021 | $1,129 | $48,176 | $10,000 | $38,176 |
| 2020 | $1,129 | $48,176 | $10,000 | $38,176 |
| 2019 | $975 | $41,156 | $6,000 | $35,156 |
| 2018 | $975 | $41,156 | $6,000 | $35,156 |
| 2017 | $1,183 | $41,156 | $6,000 | $35,156 |
| 2016 | $904 | $31,444 | $6,000 | $25,444 |
| 2015 | $563 | $19,104 | $6,000 | $13,104 |
| 2014 | $568 | $19,104 | $0 | $0 |
Source: Public Records
Map
Nearby Homes
- 1275 Clay Rd SW
- 4397 Treadle Rd SW
- 5527 Andrew Dr SW
- 5205 Silhouette Ln SW
- 1056 Retner Dr SW Unit 3
- 1047 Retner Dr SW
- 4976 Mable Lake Dr SW
- 814 Glennferry Bend SW
- 826 Glennferry Bend SW
- 5477 Blossomwood Trail SW
- 5531 Wild Cherry Dr SW
- 5615 Hislop Ln Unit 82
- 854 Joseph Club Dr SW
- 875 Joseph Club Dr SW
- 0 Brookwood Dr Unit 7577066
- 0 Brookwood Dr Unit 10519191
- 1729 Hyssop Blvd
- 1120 Grace St SW
- 1142 Grace St SW
- 1110 Grace St SW
- 1145 Grace St SW
- 1152 Grace St SW
- 1125 Grace St SW
- 1121 Luther Dr SW
- 1155 Grace St SW
- 1111 Luther Dr SW
- 1133 Luther Dr SW
- 1100 Grace St SW
- 1164 Grace St SW
- 1101 Luther Dr SW
- 1143 Luther Dr SW
- 1103 Grace St SW
- 0 Grace St SW Unit 7142248
- 0 Grace St SW Unit 7129029
- 0 Grace St SW Unit 3182022
- 0 Grace St SW
- 1167 Grace St SW