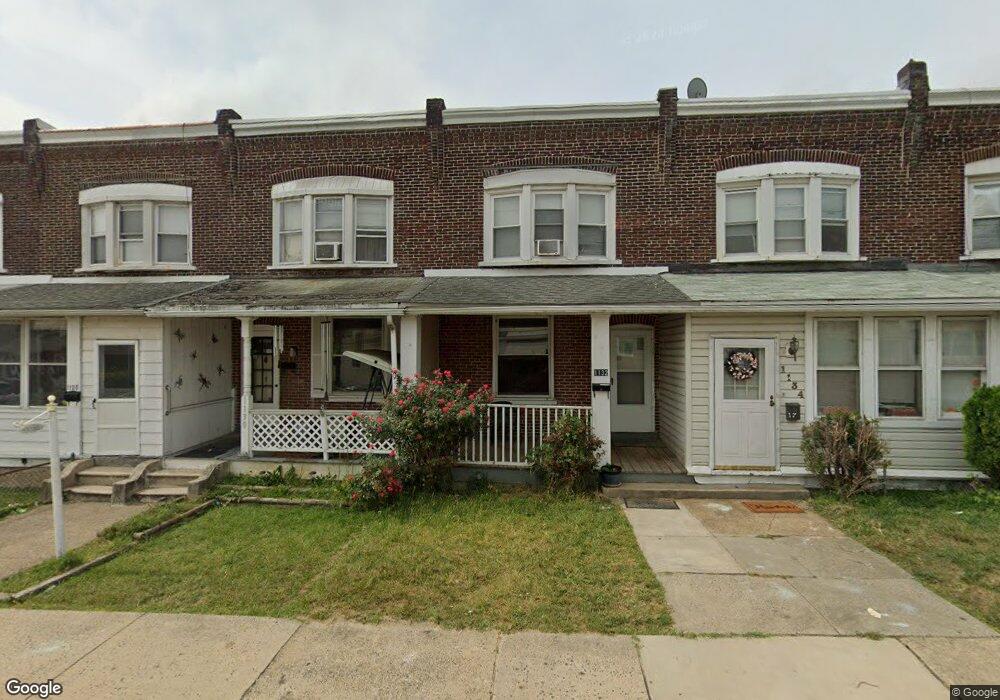
1130 Green St Marcus Hook, PA 19061
Estimated Value: $84,000 - $163,978
3
Beds
1
Bath
1,176
Sq Ft
$91/Sq Ft
Est. Value
About This Home
This home is located at 1130 Green St, Marcus Hook, PA 19061 and is currently estimated at $106,495, approximately $90 per square foot. 1130 Green St is a home located in Delaware County with nearby schools including Chichester Senior High School, Chester Charter School for the Arts, and Archmere Academy.
Ownership History
Date
Name
Owned For
Owner Type
Purchase Details
Closed on
Sep 8, 2025
Sold by
Tappenden Phillip
Bought by
Emedwa Investments Llc
Current Estimated Value
Home Financials for this Owner
Home Financials are based on the most recent Mortgage that was taken out on this home.
Original Mortgage
$114,000
Outstanding Balance
$114,000
Interest Rate
6.72%
Mortgage Type
Construction
Estimated Equity
-$7,505
Purchase Details
Closed on
Mar 3, 2025
Sold by
Tax Claim Bureau
Bought by
Tappenden Philip
Purchase Details
Closed on
Sep 11, 1985
Sold by
Dwyer Jr Elmer P
Bought by
Gray James N and Gray Jean M
Create a Home Valuation Report for This Property
The Home Valuation Report is an in-depth analysis detailing your home's value as well as a comparison with similar homes in the area
Home Values in the Area
Average Home Value in this Area
Purchase History
| Date | Buyer | Sale Price | Title Company |
|---|---|---|---|
| Emedwa Investments Llc | $85,000 | Priority Title | |
| Tappenden Philip | $42,000 | None Listed On Document | |
| Tappenden Philip | $42,000 | None Listed On Document | |
| Gray James N | $25,000 | -- |
Source: Public Records
Mortgage History
| Date | Status | Borrower | Loan Amount |
|---|---|---|---|
| Open | Emedwa Investments Llc | $114,000 |
Source: Public Records
Tax History Compared to Growth
Tax History
| Year | Tax Paid | Tax Assessment Tax Assessment Total Assessment is a certain percentage of the fair market value that is determined by local assessors to be the total taxable value of land and additions on the property. | Land | Improvement |
|---|---|---|---|---|
| 2025 | $2,781 | $67,770 | $18,760 | $49,010 |
| 2024 | $2,781 | $67,770 | $18,760 | $49,010 |
| 2023 | $2,573 | $67,770 | $18,760 | $49,010 |
| 2022 | $2,452 | $67,770 | $18,760 | $49,010 |
| 2021 | $3,446 | $67,770 | $18,760 | $49,010 |
| 2020 | $3,066 | $53,170 | $17,370 | $35,800 |
| 2019 | $3,066 | $53,170 | $17,370 | $35,800 |
| 2018 | $3,074 | $53,170 | $0 | $0 |
| 2017 | $3,053 | $53,170 | $0 | $0 |
| 2016 | $298 | $53,170 | $0 | $0 |
| 2015 | $298 | $53,170 | $0 | $0 |
| 2014 | $298 | $53,170 | $0 | $0 |
Source: Public Records
Map
Nearby Homes