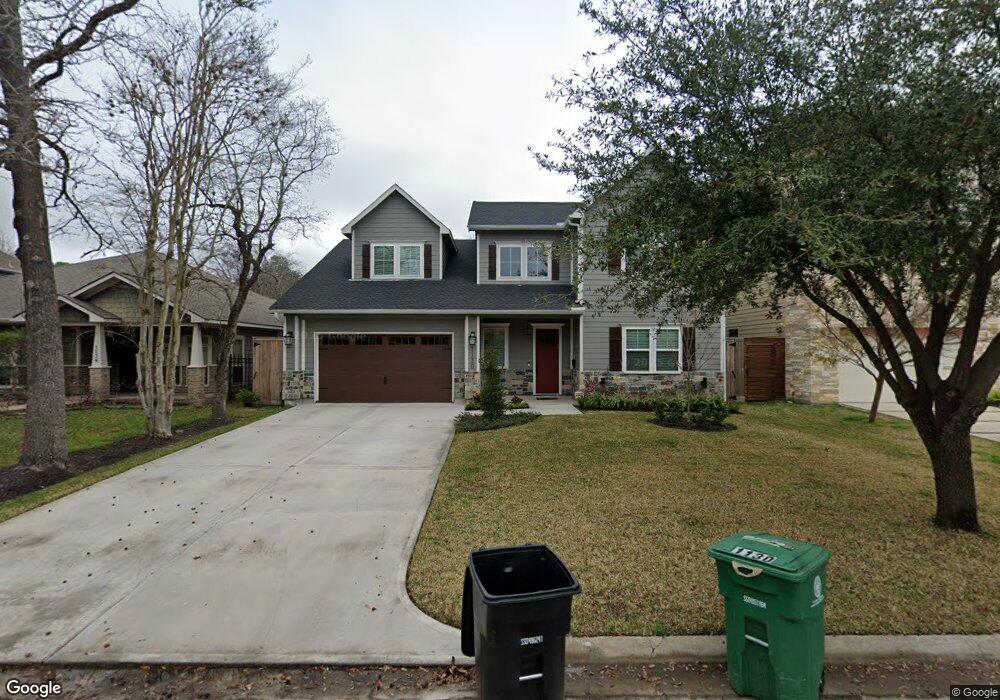
1130 Kinley Ln Houston, TX 77018
Oak Forest-Garden Oaks NeighborhoodEstimated Value: $458,000 - $1,354,000
3
Beds
2
Baths
1,070
Sq Ft
$1,018/Sq Ft
Est. Value
About This Home
This home is located at 1130 Kinley Ln, Houston, TX 77018 and is currently estimated at $1,088,905, approximately $1,017 per square foot. 1130 Kinley Ln is a home located in Harris County with nearby schools including Garden Oaks Montessori, Frank Black Middle School, and Waltrip High School.
Ownership History
Date
Name
Owned For
Owner Type
Purchase Details
Closed on
Dec 12, 2016
Sold by
Helm Juan A and Helm Christy B
Bought by
Shiveley Ashley
Current Estimated Value
Home Financials for this Owner
Home Financials are based on the most recent Mortgage that was taken out on this home.
Original Mortgage
$589,103
Outstanding Balance
$476,371
Interest Rate
3.25%
Mortgage Type
Construction
Estimated Equity
$612,535
Purchase Details
Closed on
Dec 3, 1999
Sold by
Collen Carolee
Bought by
Helm Juan A and Helm Christy B
Home Financials for this Owner
Home Financials are based on the most recent Mortgage that was taken out on this home.
Original Mortgage
$75,767
Interest Rate
7.95%
Mortgage Type
FHA
Purchase Details
Closed on
Mar 30, 1998
Sold by
Arvey Harriet H and Hedding Thomas A
Bought by
Collen Carolee
Create a Home Valuation Report for This Property
The Home Valuation Report is an in-depth analysis detailing your home's value as well as a comparison with similar homes in the area
Home Values in the Area
Average Home Value in this Area
Purchase History
| Date | Buyer | Sale Price | Title Company |
|---|---|---|---|
| Shiveley Ashley | -- | Startex Title Co | |
| Helm Juan A | -- | Regency Title | |
| Collen Carolee | -- | Regency Title |
Source: Public Records
Mortgage History
| Date | Status | Borrower | Loan Amount |
|---|---|---|---|
| Open | Shiveley Ashley | $589,103 | |
| Previous Owner | Helm Juan A | $75,767 |
Source: Public Records
Tax History Compared to Growth
Tax History
| Year | Tax Paid | Tax Assessment Tax Assessment Total Assessment is a certain percentage of the fair market value that is determined by local assessors to be the total taxable value of land and additions on the property. | Land | Improvement |
|---|---|---|---|---|
| 2025 | $18,666 | $1,098,522 | $428,806 | $669,716 |
| 2024 | $18,666 | $1,165,000 | $428,806 | $736,194 |
| 2023 | $18,666 | $1,107,725 | $428,806 | $678,919 |
| 2022 | $21,468 | $975,000 | $358,510 | $616,490 |
| 2021 | $20,784 | $963,546 | $344,450 | $619,096 |
| 2020 | $19,632 | $910,000 | $295,243 | $614,757 |
| 2019 | $18,649 | $737,000 | $295,243 | $441,757 |
| 2018 | $17,867 | $706,100 | $281,184 | $424,916 |
| 2017 | $7,426 | $293,666 | $281,184 | $12,482 |
| 2016 | $5,747 | $293,666 | $281,184 | $12,482 |
| 2015 | $940 | $308,998 | $281,184 | $27,814 |
| 2014 | $940 | $271,301 | $224,947 | $46,354 |
Source: Public Records
Map
Nearby Homes
- 1112 Kinley Ln
- 1032 W 41st St
- 1030 W 41st St
- 3720 Ella Blvd
- 1148 Du Barry Ln
- 1115 Du Barry Ln
- 1226 Chippendale Rd
- 1025 Wakefield Dr
- 1225 Althea Dr
- 1021 Wakefield Dr
- 1050 W 42nd St
- 1226 Du Barry Ln
- 4105 Ella Blvd
- 1003 Wakefield Dr
- 1237 Althea Dr
- 3527 Ella Blvd
- 954 Fisher St Unit E
- 1020 W 42nd St
- 1249 Chippendale Rd
- 1261 Wakefield Dr