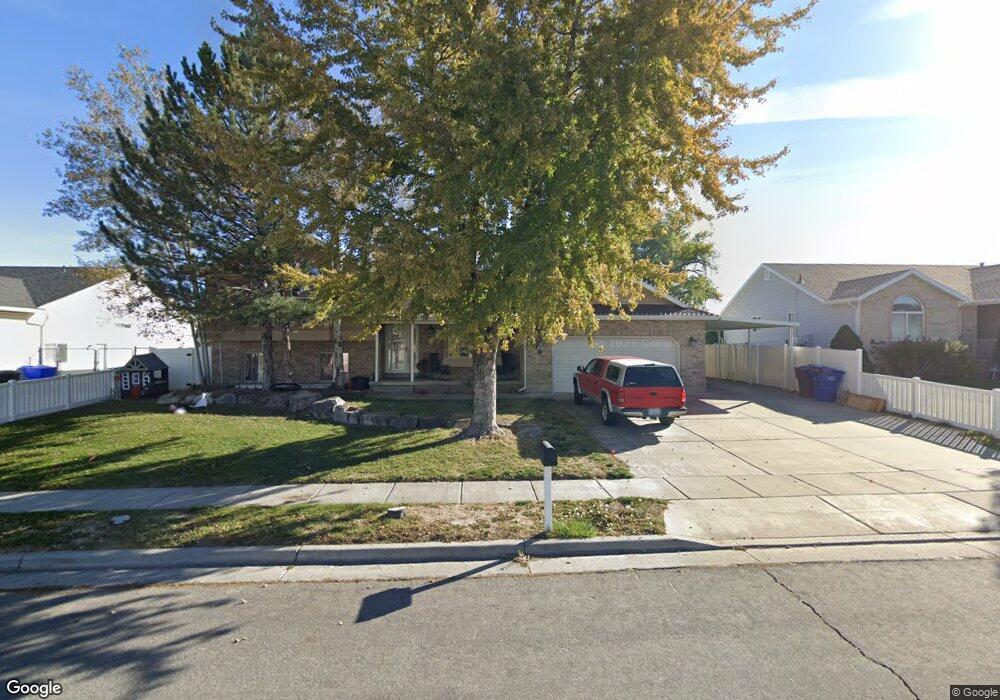
1130 N 3050 W Clearfield, UT 84015
Estimated Value: $479,000 - $658,000
5
Beds
4
Baths
3,010
Sq Ft
$188/Sq Ft
Est. Value
About This Home
This home is located at 1130 N 3050 W, Clearfield, UT 84015 and is currently estimated at $565,568, approximately $187 per square foot. 1130 N 3050 W is a home located in Davis County with nearby schools including Lakeside School, West Point Junior High School, and Syracuse High School.
Ownership History
Date
Name
Owned For
Owner Type
Purchase Details
Closed on
Dec 3, 2019
Sold by
Fullmer Dallas W
Bought by
Hatori Austin D and Aiken Robyn
Current Estimated Value
Home Financials for this Owner
Home Financials are based on the most recent Mortgage that was taken out on this home.
Original Mortgage
$381,954
Outstanding Balance
$340,980
Interest Rate
4.37%
Mortgage Type
FHA
Estimated Equity
$224,588
Purchase Details
Closed on
Nov 20, 1998
Sold by
Cox Clair
Bought by
Fullmer Dallas W
Home Financials for this Owner
Home Financials are based on the most recent Mortgage that was taken out on this home.
Original Mortgage
$114,600
Interest Rate
6.52%
Mortgage Type
Balloon
Purchase Details
Closed on
Jun 9, 1997
Sold by
New Hampton Manor Associates
Bought by
Cox Clair
Home Financials for this Owner
Home Financials are based on the most recent Mortgage that was taken out on this home.
Original Mortgage
$14,950
Interest Rate
7.98%
Mortgage Type
Seller Take Back
Create a Home Valuation Report for This Property
The Home Valuation Report is an in-depth analysis detailing your home's value as well as a comparison with similar homes in the area
Home Values in the Area
Average Home Value in this Area
Purchase History
| Date | Buyer | Sale Price | Title Company |
|---|---|---|---|
| Hatori Austin D | -- | Vanguard Title Inc Ag L | |
| Fullmer Dallas W | -- | Mountain View Title & Escrow | |
| Cox Clair | -- | Security Title Company |
Source: Public Records
Mortgage History
| Date | Status | Borrower | Loan Amount |
|---|---|---|---|
| Open | Hatori Austin D | $381,954 | |
| Previous Owner | Fullmer Dallas W | $114,600 | |
| Previous Owner | Cox Clair | $14,950 | |
| Closed | Fullmer Dallas W | $30,580 |
Source: Public Records
Tax History Compared to Growth
Tax History
| Year | Tax Paid | Tax Assessment Tax Assessment Total Assessment is a certain percentage of the fair market value that is determined by local assessors to be the total taxable value of land and additions on the property. | Land | Improvement |
|---|---|---|---|---|
| 2025 | $3,140 | $294,250 | $102,005 | $192,245 |
| 2024 | $3,033 | $285,450 | $91,887 | $193,563 |
| 2023 | $2,928 | $507,000 | $111,366 | $395,634 |
| 2022 | $3,168 | $300,300 | $57,064 | $243,236 |
| 2021 | $2,885 | $409,000 | $92,551 | $316,449 |
| 2020 | $2,537 | $355,000 | $77,123 | $277,877 |
| 2019 | $2,116 | $292,000 | $75,011 | $216,989 |
| 2018 | $1,927 | $262,000 | $76,402 | $185,598 |
| 2016 | $1,701 | $121,715 | $29,500 | $92,215 |
| 2015 | $1,716 | $116,380 | $29,500 | $86,880 |
| 2014 | $1,568 | $107,805 | $29,500 | $78,305 |
| 2013 | -- | $95,911 | $25,850 | $70,061 |
Source: Public Records
Map
Nearby Homes