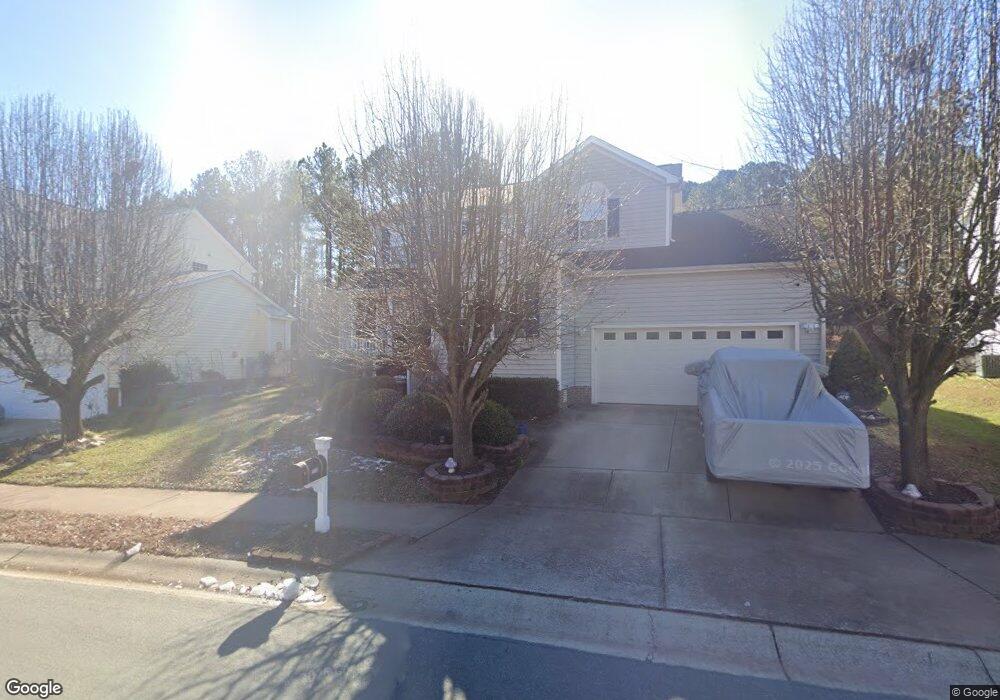
1130 Pebble Creek Crossing Durham, NC 27713
Woodcroft NeighborhoodEstimated Value: $496,000 - $554,000
5
Beds
3
Baths
2,385
Sq Ft
$219/Sq Ft
Est. Value
About This Home
This home is located at 1130 Pebble Creek Crossing, Durham, NC 27713 and is currently estimated at $523,386, approximately $219 per square foot. 1130 Pebble Creek Crossing is a home located in Durham County with nearby schools including Pearsontown Elementary School, Lowe's Grove Middle, and Hillside High School.
Ownership History
Date
Name
Owned For
Owner Type
Purchase Details
Closed on
Jun 11, 2008
Sold by
Coley Carl B and Ma Juan Gui
Bought by
Mcleod Donald and Yee Joan
Current Estimated Value
Home Financials for this Owner
Home Financials are based on the most recent Mortgage that was taken out on this home.
Original Mortgage
$173,040
Interest Rate
6.08%
Mortgage Type
Purchase Money Mortgage
Purchase Details
Closed on
Mar 26, 2007
Sold by
Veach Jeffrey L and Veach Sherry A
Bought by
Coley Carl B and Gui Ma Juan
Home Financials for this Owner
Home Financials are based on the most recent Mortgage that was taken out on this home.
Original Mortgage
$199,900
Interest Rate
8.2%
Mortgage Type
Balloon
Purchase Details
Closed on
Apr 8, 2002
Sold by
M/I Schottenstein Homes Inc
Bought by
Veach Jeffrey L and Veach Sherry A
Home Financials for this Owner
Home Financials are based on the most recent Mortgage that was taken out on this home.
Original Mortgage
$160,000
Interest Rate
6.8%
Create a Home Valuation Report for This Property
The Home Valuation Report is an in-depth analysis detailing your home's value as well as a comparison with similar homes in the area
Home Values in the Area
Average Home Value in this Area
Purchase History
| Date | Buyer | Sale Price | Title Company |
|---|---|---|---|
| Mcleod Donald | $216,300 | None Available | |
| Coley Carl B | $249,900 | None Available | |
| Veach Jeffrey L | $216,000 | -- |
Source: Public Records
Mortgage History
| Date | Status | Borrower | Loan Amount |
|---|---|---|---|
| Closed | Mcleod Donald | $173,040 | |
| Previous Owner | Coley Carl B | $199,900 | |
| Previous Owner | Veach Jeffrey L | $160,000 | |
| Closed | Veach Jeffrey L | $45,000 |
Source: Public Records
Tax History Compared to Growth
Tax History
| Year | Tax Paid | Tax Assessment Tax Assessment Total Assessment is a certain percentage of the fair market value that is determined by local assessors to be the total taxable value of land and additions on the property. | Land | Improvement |
|---|---|---|---|---|
| 2025 | $3,687 | $494,919 | $94,248 | $400,671 |
| 2024 | $3,687 | $264,342 | $40,451 | $223,891 |
| 2023 | $3,463 | $264,342 | $40,451 | $223,891 |
| 2022 | $3,383 | $264,342 | $40,451 | $223,891 |
| 2021 | $3,367 | $264,342 | $40,451 | $223,891 |
| 2020 | $3,288 | $264,342 | $40,451 | $223,891 |
| 2019 | $3,288 | $264,342 | $40,451 | $223,891 |
| 2018 | $3,425 | $252,472 | $54,297 | $198,175 |
| 2017 | $3,400 | $252,472 | $54,297 | $198,175 |
| 2016 | $3,285 | $252,472 | $54,297 | $198,175 |
| 2015 | $3,641 | $263,054 | $60,276 | $202,778 |
| 2014 | $3,641 | $263,054 | $60,276 | $202,778 |
Source: Public Records
Map
Nearby Homes
- 1 Chownings St
- 3 Chownings St
- 1045 Flagler St
- 1003 Crimson Dr Unit 2
- 1062 Flagler St
- 1001 Pebble Creek Crossing Unit 12
- 1122 Vermillion Dr
- 1308 Snyder St
- 3 Newgate Ct
- 909 Windcrest Rd
- 1003 Canary Pepper Dr
- 6132 Yellowstone Dr
- 1304 Copper Creek Dr
- 3111 Dunnock Dr
- 2015 Rooster Spur Ct
- 6502 Barbee Rd
- 901 Forge Rd
- 1107 Rocketcress Dr
- 5624 Barbee Rd
- 1017 Red Hat Ln
- 1132 Pebble Creek Crossing
- 1128 Pebble Creek Crossing
- 1134 Pebble Creek Crossing
- 1126 Pebble Creek Crossing
- 1129 Pebble Creek Crossing
- 1124 Pebble Creek Crossing
- 1136 Pebble Creek Crossing
- 1127 Pebble Creek Crossing
- 104 Whitney Ln
- 1122 Pebble Creek Crossing
- 1135 Pebble Creek Crossing
- 106 Whitney Ln
- 1140 Pebble Creek Crossing
- 1137 Pebble Creek Crossing
- 1120 Pebble Creek Crossing
- 108 Whitney Ln
- 1142 Pebble Creek Crossing
- 1139 Pebble Creek Crossing
- 1118 Pebble Creek Crossing
- 110 Whitney Ln