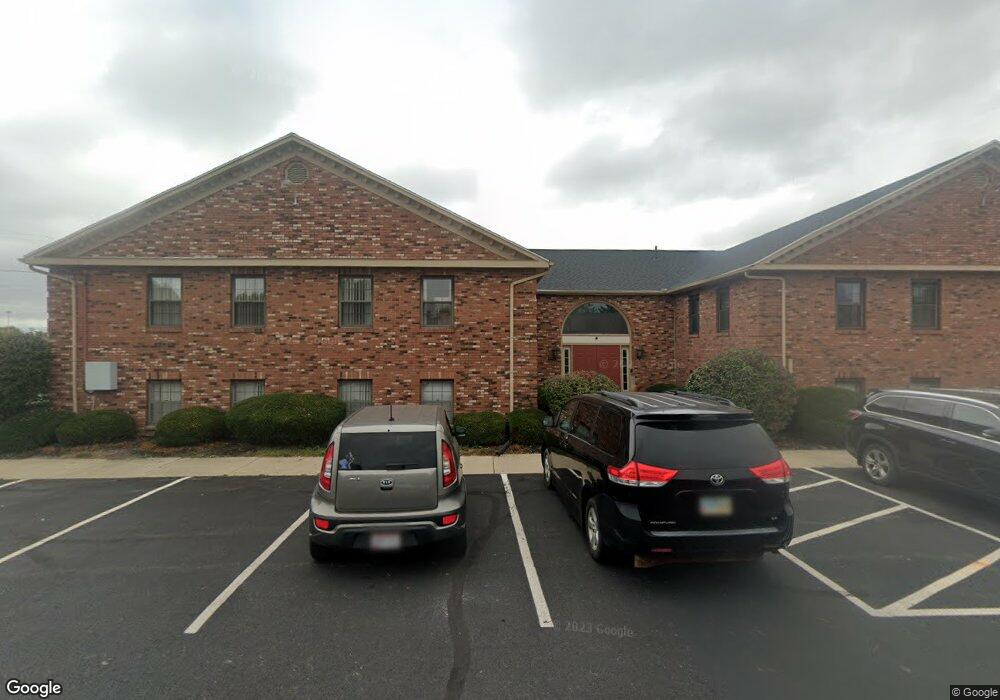
1130 Vester Ave Unit D Springfield, OH 45503
Estimated Value: $776,076
Studio
--
Bath
13,424
Sq Ft
$58/Sq Ft
Est. Value
About This Home
This home is located at 1130 Vester Ave Unit D, Springfield, OH 45503 and is currently estimated at $776,076, approximately $57 per square foot. 1130 Vester Ave Unit D is a home located in Clark County with nearby schools including Kenton Elementary School, Roosevelt Middle School, and Springfield High School.
Ownership History
Date
Name
Owned For
Owner Type
Purchase Details
Closed on
Sep 20, 2024
Sold by
1130 Vester Corporation
Bought by
Miller Mary E and Tleimat Hazem
Current Estimated Value
Home Financials for this Owner
Home Financials are based on the most recent Mortgage that was taken out on this home.
Original Mortgage
$562,500
Outstanding Balance
$544,607
Interest Rate
6.49%
Mortgage Type
Credit Line Revolving
Estimated Equity
$231,469
Purchase Details
Closed on
Mar 24, 2023
Sold by
Arora Suraj
Bought by
1130 Vester Corporation
Purchase Details
Closed on
Dec 8, 2021
Sold by
Agreement And Declaration Of Trust
Bought by
Arora Suraj
Home Financials for this Owner
Home Financials are based on the most recent Mortgage that was taken out on this home.
Original Mortgage
$270,000
Interest Rate
3.22%
Mortgage Type
New Conventional
Purchase Details
Closed on
Oct 1, 1986
Bought by
Kuss R L Trustee
Create a Home Valuation Report for This Property
The Home Valuation Report is an in-depth analysis detailing your home's value as well as a comparison with similar homes in the area
Home Values in the Area
Average Home Value in this Area
Purchase History
| Date | Buyer | Sale Price | Title Company |
|---|---|---|---|
| Miller Mary E | $750,000 | Northwest Title & Escrow | |
| 1130 Vester Corporation | -- | None Listed On Document | |
| Arora Suraj | $360,000 | American Homeland Title | |
| Kuss R L Trustee | $260,000 | -- |
Source: Public Records
Mortgage History
| Date | Status | Borrower | Loan Amount |
|---|---|---|---|
| Open | Miller Mary E | $562,500 | |
| Previous Owner | Arora Suraj | $270,000 |
Source: Public Records
Tax History
| Year | Tax Paid | Tax Assessment Tax Assessment Total Assessment is a certain percentage of the fair market value that is determined by local assessors to be the total taxable value of land and additions on the property. | Land | Improvement |
|---|---|---|---|---|
| 2025 | $9,947 | $257,640 | $35,540 | $222,100 |
| 2024 | $9,778 | $134,750 | $25,390 | $109,360 |
| 2023 | $9,778 | $134,750 | $25,390 | $109,360 |
| 2022 | $0 | $134,750 | $25,390 | $109,360 |
| 2021 | $14,611 | $200,030 | $25,390 | $174,640 |
| 2020 | $14,608 | $200,030 | $25,390 | $174,640 |
| 2019 | $14,647 | $200,030 | $25,390 | $174,640 |
| 2018 | $14,372 | $195,810 | $25,390 | $170,420 |
| 2017 | $14,464 | $195,805 | $25,386 | $170,419 |
| 2016 | $14,390 | $195,805 | $25,386 | $170,419 |
| 2015 | $14,562 | $195,805 | $25,386 | $170,419 |
| 2014 | $14,401 | $195,805 | $25,386 | $170,419 |
| 2013 | $14,077 | $195,805 | $25,386 | $170,419 |
Source: Public Records
Map
Nearby Homes
- 1225 Vester Ave
- 3124 El Camino Dr
- 3135 Imperial Blvd
- 615 Villa Rd Unit K
- 1032 Armsgate Rd
- 1516 Hyannis Dr
- 1040 Carson Ln
- 2553 Derr Rd
- 3250 Argonne Ln N
- 1139 Bradford Dr
- 2824 Balsam Dr
- 3153 Argonne Ln N
- 3247 Argonne Ln N Unit 3247
- 1136 Foxboro Rd Unit 202
- 2439 Greystone Ln
- 1149 Foxboro Rd
- 2951 Archer Ln
- 1924 Marinette Dr
- 1315 Greystone Dr
- 1323 Greystone Dr
- 1130 Vester Ave Unit G
- 1151 Vester Ave
- 1121 Vester Ave Unit 1121
- 1153 Vester Ave
- 1123 Vester Ave
- 1201 Vester Ave
- 3152 El Camino Dr
- 2108 Gold Medal Cir Unit 2108
- 3126 El Camino Dr Unit 1
- 3124 El Camino Dr Unit 2
- 3150 El Camino Dr
- 3150 El Camino Dr Unit 1
- 1203 Vester Ave
- 1125 Vester Ave
- 1155 Vester Ave Unit 1155
- 3122 El Camino Dr
- 3144 El Camino Dr
- 3120 El Camino Dr Unit 4
- 1127 Vester Ave
- 1157 Vester Ave
Your Personal Tour Guide
Ask me questions while you tour the home.