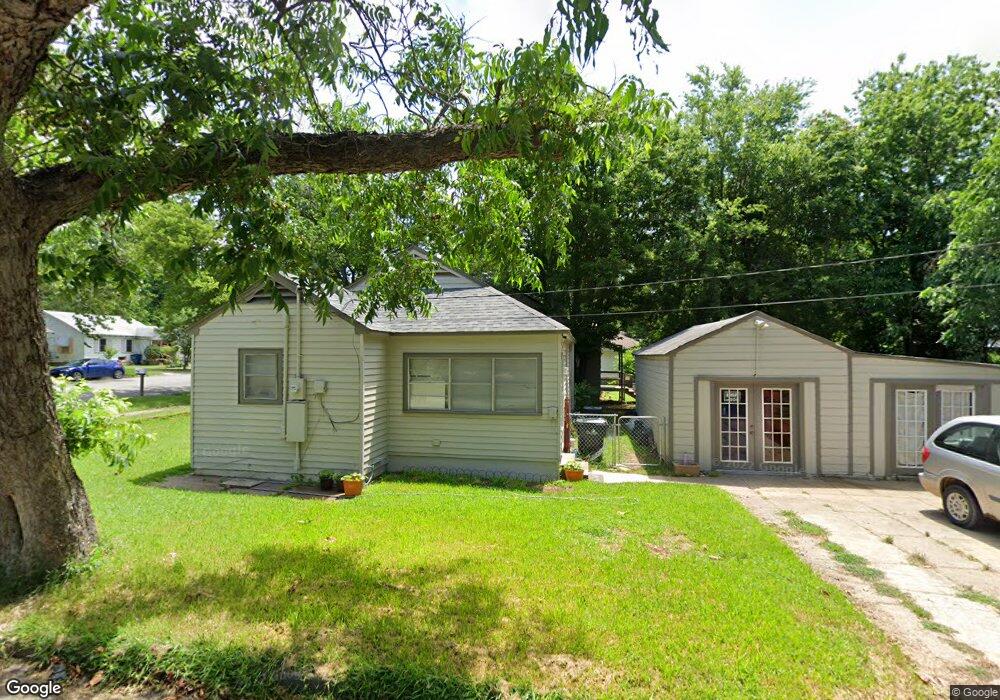
1130 W Chestnut St Denison, TX 75020
Estimated Value: $159,470 - $233,000
2
Beds
1
Bath
1,152
Sq Ft
$170/Sq Ft
Est. Value
About This Home
This home is located at 1130 W Chestnut St, Denison, TX 75020 and is currently estimated at $196,235, approximately $170 per square foot. 1130 W Chestnut St is a home located in Grayson County with nearby schools including Houston Elementary School, Scott Middle School, and Denison High School.
Ownership History
Date
Name
Owned For
Owner Type
Purchase Details
Closed on
Jul 13, 2020
Sold by
Severson Maxine J
Bought by
Mistry Rashmiben
Current Estimated Value
Home Financials for this Owner
Home Financials are based on the most recent Mortgage that was taken out on this home.
Original Mortgage
$103,550
Outstanding Balance
$91,821
Interest Rate
3.1%
Mortgage Type
New Conventional
Estimated Equity
$104,414
Purchase Details
Closed on
Feb 22, 2005
Sold by
Vickrey Donald G and Vickrey Carolyn S
Bought by
Severson Maxine J
Home Financials for this Owner
Home Financials are based on the most recent Mortgage that was taken out on this home.
Original Mortgage
$59,033
Interest Rate
5.77%
Mortgage Type
FHA
Purchase Details
Closed on
Aug 11, 2004
Sold by
Hud
Bought by
Vickrey William A and Vickrey Donald G
Home Financials for this Owner
Home Financials are based on the most recent Mortgage that was taken out on this home.
Original Mortgage
$26,500
Interest Rate
6.18%
Mortgage Type
FHA
Purchase Details
Closed on
May 6, 2004
Sold by
Chase Manhattan Mortgage Corp
Bought by
Hud
Purchase Details
Closed on
Mar 2, 2004
Sold by
Jackson Zelda F
Bought by
Chase Manhattan Mortgage Corp
Create a Home Valuation Report for This Property
The Home Valuation Report is an in-depth analysis detailing your home's value as well as a comparison with similar homes in the area
Home Values in the Area
Average Home Value in this Area
Purchase History
| Date | Buyer | Sale Price | Title Company |
|---|---|---|---|
| Mistry Rashmiben | -- | Grayson County Title | |
| Severson Maxine J | -- | -- | |
| Vickrey William A | -- | -- | |
| Hud | -- | -- | |
| Chase Manhattan Mortgage Corp | $28,524 | -- |
Source: Public Records
Mortgage History
| Date | Status | Borrower | Loan Amount |
|---|---|---|---|
| Open | Mistry Rashmiben | $103,550 | |
| Previous Owner | Severson Maxine J | $59,033 | |
| Previous Owner | Vickrey William A | $26,500 |
Source: Public Records
Tax History Compared to Growth
Tax History
| Year | Tax Paid | Tax Assessment Tax Assessment Total Assessment is a certain percentage of the fair market value that is determined by local assessors to be the total taxable value of land and additions on the property. | Land | Improvement |
|---|---|---|---|---|
| 2025 | $3,515 | $149,761 | $40,200 | $109,561 |
| 2024 | $3,515 | $151,289 | $40,200 | $111,089 |
| 2023 | $3,718 | $164,096 | $36,840 | $127,256 |
| 2022 | $3,481 | $146,519 | $36,840 | $109,679 |
| 2021 | $2,736 | $108,465 | $19,800 | $88,665 |
| 2020 | $2,328 | $100,464 | $12,000 | $88,464 |
| 2019 | $2,287 | $100,450 | $11,160 | $89,290 |
| 2018 | $2,070 | $84,800 | $6,300 | $78,500 |
| 2017 | $1,852 | $72,350 | $5,580 | $66,770 |
| 2016 | $1,588 | $56,750 | $3,480 | $53,270 |
| 2015 | $0 | $53,575 | $4,980 | $48,595 |
| 2014 | -- | $53,575 | $4,980 | $48,595 |
Source: Public Records
Map
Nearby Homes
- 1109 W Crawford St
- 1027 W Crawford St
- 1221 W Crawford St
- 1223 W Owing St
- 1120 W Owing St
- 1231 W Main St
- 108 N Eddy Ave
- 1127 W Morgan St
- 1230 W Woodard St
- 1326 W Crawford St
- 1200 W Gandy St
- 1319 W Morgan St
- 501 S Eddy Ave
- 1217 W Nelson St
- 1031 W Gandy St
- TBD W Main St
- 831 W Owing St
- 826 W Crawford St
- 920 W Morgan St
- 1224 W Nelson St
- 1126 W Chestnut St
- 1122 W Chestnut St
- 1200 W Chestnut St
- 1131 W Crawford St
- 1127 W Crawford St
- 1120 W Chestnut St
- 227 S Perry Ave
- 1119 W Crawford St
- 1206 W Chestnut St
- 1114 W Chestnut St
- 1131 W Chestnut St
- 1117 W Crawford St
- 1121 W Chestnut St
- 1201 W Crawford St
- 1208 W Chestnut St
- 1201 W Chestnut St
- 1115 W Crawford St
- 1112 W Chestnut St
- 1119 W Chestnut St
- 1209 W Crawford St