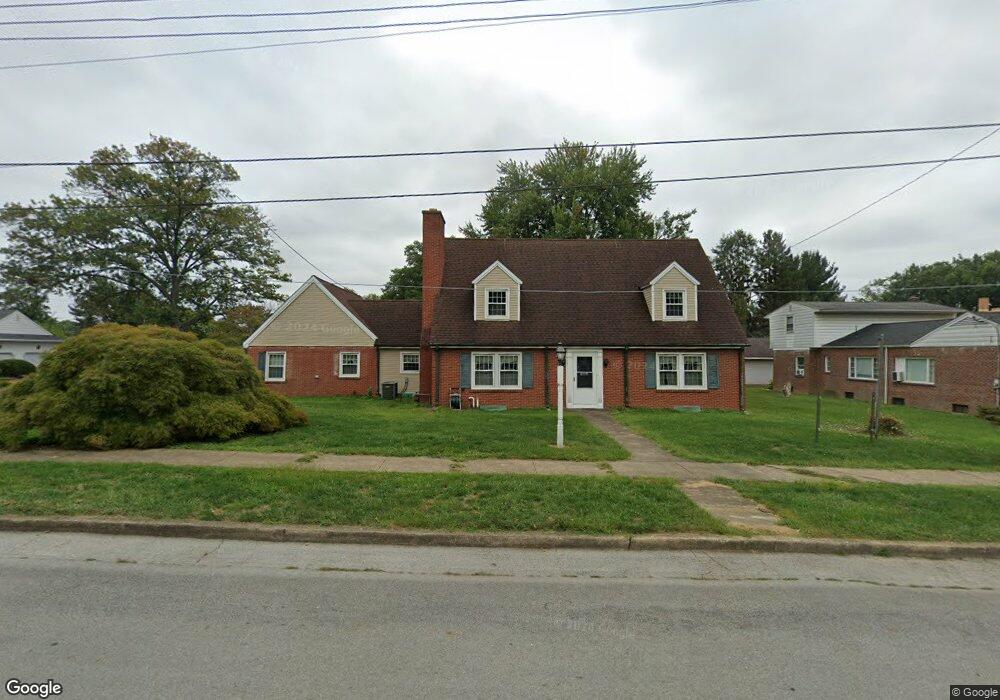
1130 Walnut St Columbia, PA 17512
Estimated Value: $390,000 - $432,000
4
Beds
3
Baths
2,336
Sq Ft
$174/Sq Ft
Est. Value
About This Home
This home is located at 1130 Walnut St, Columbia, PA 17512 and is currently estimated at $406,160, approximately $173 per square foot. 1130 Walnut St is a home located in Lancaster County with nearby schools including Columbia Middle School, Columbia High School, and Our Lady of the Angels School.
Ownership History
Date
Name
Owned For
Owner Type
Purchase Details
Closed on
Apr 17, 2013
Sold by
Gable Michael S and Johanna Gable E
Bought by
Gable Michael S
Current Estimated Value
Home Financials for this Owner
Home Financials are based on the most recent Mortgage that was taken out on this home.
Original Mortgage
$141,600
Outstanding Balance
$100,176
Interest Rate
3.52%
Mortgage Type
New Conventional
Estimated Equity
$305,984
Purchase Details
Closed on
Jun 29, 2001
Sold by
Pickle Catharine H
Bought by
Gable Michael S and Johanna Gable E
Home Financials for this Owner
Home Financials are based on the most recent Mortgage that was taken out on this home.
Original Mortgage
$146,284
Interest Rate
7.21%
Create a Home Valuation Report for This Property
The Home Valuation Report is an in-depth analysis detailing your home's value as well as a comparison with similar homes in the area
Home Values in the Area
Average Home Value in this Area
Purchase History
| Date | Buyer | Sale Price | Title Company |
|---|---|---|---|
| Gable Michael S | -- | None Available | |
| Gable Michael S | $159,900 | -- |
Source: Public Records
Mortgage History
| Date | Status | Borrower | Loan Amount |
|---|---|---|---|
| Open | Gable Michael S | $141,600 | |
| Closed | Gable Michael S | $146,284 |
Source: Public Records
Tax History Compared to Growth
Tax History
| Year | Tax Paid | Tax Assessment Tax Assessment Total Assessment is a certain percentage of the fair market value that is determined by local assessors to be the total taxable value of land and additions on the property. | Land | Improvement |
|---|---|---|---|---|
| 2025 | $7,527 | $201,400 | $42,200 | $159,200 |
| 2024 | $7,527 | $201,400 | $42,200 | $159,200 |
| 2023 | $7,527 | $201,400 | $42,200 | $159,200 |
| 2022 | $7,527 | $201,400 | $42,200 | $159,200 |
| 2021 | $7,527 | $201,400 | $42,200 | $159,200 |
| 2020 | $7,527 | $201,400 | $42,200 | $159,200 |
| 2019 | $7,397 | $201,400 | $42,200 | $159,200 |
| 2018 | $4,890 | $201,400 | $42,200 | $159,200 |
| 2017 | $6,576 | $160,100 | $39,500 | $120,600 |
| 2016 | $6,576 | $160,100 | $39,500 | $120,600 |
| 2015 | $1,879 | $160,100 | $39,500 | $120,600 |
| 2014 | $4,214 | $160,100 | $39,500 | $120,600 |
Source: Public Records
Map
Nearby Homes