Estimated Value: $235,000 - $308,000
2
Beds
2
Baths
1,342
Sq Ft
$200/Sq Ft
Est. Value
About This Home
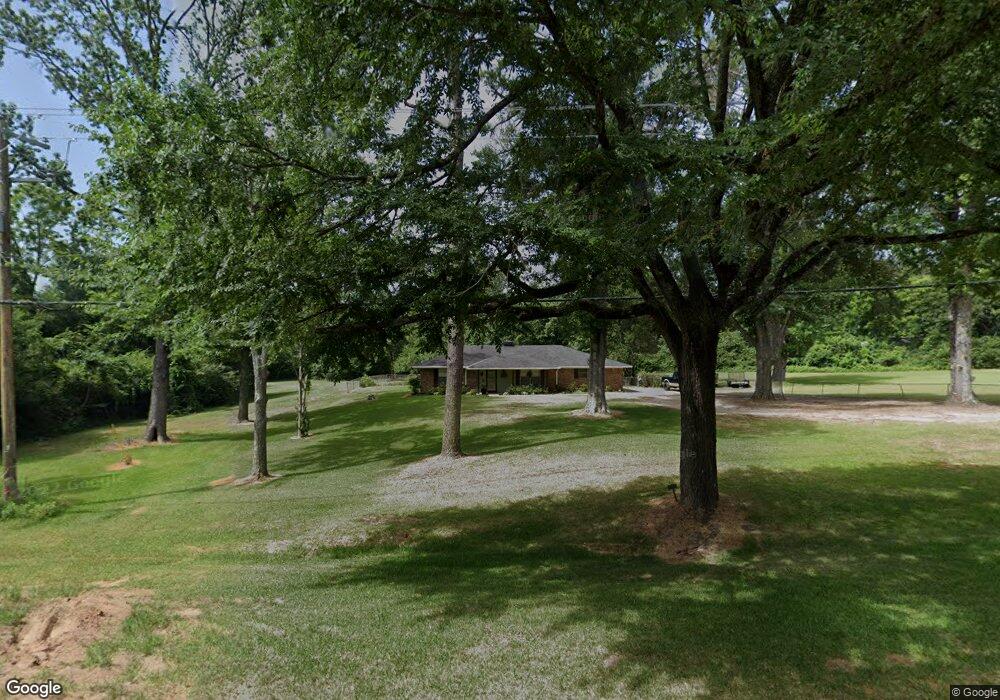
This home is located at 11300 County Road 219, Tyler, TX 75707 and is currently estimated at $267,840, approximately $199 per square foot. 11300 County Road 219 is a home located in Smith County with nearby schools including Kissam Intermediate School, Jackson Elementary School, and Chapel Hill Middle School.
Ownership History
Date
Name
Owned For
Owner Type
Purchase Details
Closed on
Jun 15, 2022
Sold by
Mitchell Sorrow Tony
Bought by
Conine Dustin Gregory
Current Estimated Value
Home Financials for this Owner
Home Financials are based on the most recent Mortgage that was taken out on this home.
Original Mortgage
$285,154
Outstanding Balance
$270,939
Interest Rate
5.27%
Mortgage Type
FHA
Estimated Equity
-$3,099
Purchase Details
Closed on
Jul 29, 2016
Sold by
Ray Kenny Wayne and Ray Keith A
Bought by
Sorrow Tony Mitchell and Sorrow Taylor
Home Financials for this Owner
Home Financials are based on the most recent Mortgage that was taken out on this home.
Original Mortgage
$138,303
Interest Rate
3.56%
Mortgage Type
New Conventional
Create a Home Valuation Report for This Property
The Home Valuation Report is an in-depth analysis detailing your home's value as well as a comparison with similar homes in the area
Home Values in the Area
Average Home Value in this Area
Purchase History
| Date | Buyer | Sale Price | Title Company |
|---|---|---|---|
| Conine Dustin Gregory | -- | None Listed On Document | |
| Sorrow Tony Mitchell | -- | None Available |
Source: Public Records
Mortgage History
| Date | Status | Borrower | Loan Amount |
|---|---|---|---|
| Open | Conine Dustin Gregory | $285,154 | |
| Previous Owner | Sorrow Tony Mitchell | $138,303 | |
| Closed | Conine Dustin Gregory | $8,554 |
Source: Public Records
Tax History Compared to Growth
Tax History
| Year | Tax Paid | Tax Assessment Tax Assessment Total Assessment is a certain percentage of the fair market value that is determined by local assessors to be the total taxable value of land and additions on the property. | Land | Improvement |
|---|---|---|---|---|
| 2025 | $2,649 | $226,430 | $90,512 | $135,918 |
| 2024 | $2,649 | $217,438 | $79,771 | $137,667 |
| 2023 | $4,085 | $239,163 | $79,771 | $159,392 |
| 2022 | $2,464 | $163,940 | $61,364 | $102,576 |
| 2021 | $2,387 | $140,117 | $61,364 | $78,753 |
| 2020 | $2,437 | $137,235 | $61,364 | $75,871 |
| 2019 | $2,646 | $142,867 | $61,364 | $81,503 |
| 2018 | $2,444 | $141,679 | $61,364 | $80,315 |
| 2017 | $2,234 | $120,434 | $36,103 | $84,331 |
| 2016 | $2,056 | $110,883 | $37,626 | $73,257 |
| 2015 | $1,548 | $112,920 | $37,626 | $75,294 |
| 2014 | $1,548 | $109,160 | $37,626 | $71,534 |
Source: Public Records
Map
Nearby Homes
- 00 County Road 2209
- 8217 County Road 219
- 8226 County Road 219
- 3507 Chapel View
- 3515 Chapel View
- 3515 & 3507 Chapel View
- 4037 Hanover Place
- 4215 Chapel Quarters
- 3516 Cabot Ln
- 4024 Hanover Place
- 11452 County Road 2326
- 4322 Madera Dr
- 10789 County Road 214
- 4029 Hanover Place
- 4025 Hanover Place
- 4021 Hanover Place
- 10205 County Road 272
- 3962 Hanover Place
- 10130 State Highway 64 E
- 4133 Colina Trail
- 11325 County Road 219
- 11263 County Road 219
- 11335 County Road 219
- 11243 County Road 219
- 10942 County Road 210
- 11367 County Road 219
- 10892 County Road 210
- 11254 County Road 219
- 11120 County Road 219
- 11397 County Road 219
- 10874 County Road 210
- 11151 Spur 248
- 11425 County Road 219
- 11074 County Road 219
- 11219 Cr 219 Unit#213
- 11219 County Road 219
- 11219 11219 Cr 219 Unit 204
- 11219 11219 Cr 219 Unit 210
- 11219 11219 Cr 219 Unit 202
- 11219 11219 Cr 219 Unit 203