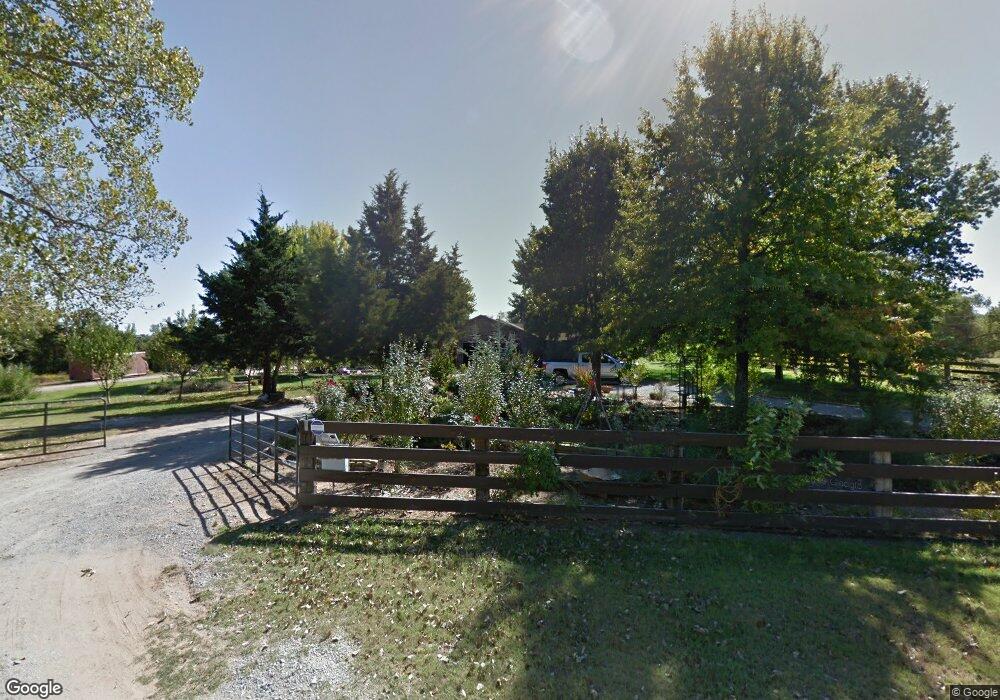
11300 Shady Oak Jones, OK 73049
Green Pastures NeighborhoodEstimated Value: $314,000 - $415,597
4
Beds
2
Baths
2,168
Sq Ft
$166/Sq Ft
Est. Value
About This Home
This home is located at 11300 Shady Oak, Jones, OK 73049 and is currently estimated at $358,899, approximately $165 per square foot. 11300 Shady Oak is a home with nearby schools including Jones Elementary School, Jones Middle School, and Jones High School.
Ownership History
Date
Name
Owned For
Owner Type
Purchase Details
Closed on
Dec 13, 2022
Sold by
James Jones Betty Mcceavley Revocable Tr and Mcceavley Betty
Bought by
Steven Todd Fields Revocable Living Trust
Current Estimated Value
Purchase Details
Closed on
Apr 27, 2014
Sold by
Mccauley Kelly Dawn
Bought by
Mccauley Kelly Dawn and The Kelly Dawn Mccauley Revoca
Purchase Details
Closed on
Mar 16, 2011
Sold by
Weiher Randy R and Weiher Lydia M
Bought by
Mccauley Kelly D
Home Financials for this Owner
Home Financials are based on the most recent Mortgage that was taken out on this home.
Original Mortgage
$110,000
Interest Rate
4.78%
Mortgage Type
New Conventional
Purchase Details
Closed on
Sep 16, 2005
Sold by
Weiher Roy Gene and Weiher Judith Ann
Bought by
Weiher Randy R and Weiher Lydia M
Home Financials for this Owner
Home Financials are based on the most recent Mortgage that was taken out on this home.
Original Mortgage
$109,137
Interest Rate
5.73%
Mortgage Type
FHA
Create a Home Valuation Report for This Property
The Home Valuation Report is an in-depth analysis detailing your home's value as well as a comparison with similar homes in the area
Home Values in the Area
Average Home Value in this Area
Purchase History
| Date | Buyer | Sale Price | Title Company |
|---|---|---|---|
| Steven Todd Fields Revocable Living Trust | -- | None Listed On Document | |
| Mccauley Kelly Dawn | -- | None Available | |
| Mccauley Kelly D | $194,500 | American Eagle Title Ins Co | |
| Weiher Randy R | $110,000 | Oklahoma City Abstract & Tit |
Source: Public Records
Mortgage History
| Date | Status | Borrower | Loan Amount |
|---|---|---|---|
| Previous Owner | Mccauley Kelly D | $110,000 | |
| Previous Owner | Weiher Randy R | $109,137 |
Source: Public Records
Tax History Compared to Growth
Tax History
| Year | Tax Paid | Tax Assessment Tax Assessment Total Assessment is a certain percentage of the fair market value that is determined by local assessors to be the total taxable value of land and additions on the property. | Land | Improvement |
|---|---|---|---|---|
| 2024 | $3,584 | $29,532 | $3,802 | $25,730 |
| 2023 | $3,584 | $28,125 | $3,980 | $24,145 |
| 2022 | $3,332 | $26,786 | $4,301 | $22,485 |
| 2021 | $3,213 | $25,510 | $4,753 | $20,757 |
| 2020 | $3,086 | $24,296 | $4,952 | $19,344 |
| 2019 | $3,026 | $23,139 | $4,787 | $18,352 |
| 2018 | $2,903 | $22,037 | $0 | $0 |
| 2017 | $2,741 | $20,988 | $3,588 | $17,400 |
| 2016 | $2,612 | $19,988 | $3,616 | $16,372 |
| 2015 | $2,862 | $22,671 | $3,387 | $19,284 |
| 2014 | $2,757 | $21,591 | $3,616 | $17,975 |
Source: Public Records
Map
Nearby Homes
- 11300 N Westminster Rd
- 203 SW 2nd Terrace
- 8312 Spencer Jones Rd
- 112 Olde Mill Rd
- 217 Olde Mill Ct
- 12624 E Hefner Rd
- 213 Olde Mill Ct
- 141190200 John St
- 4 Westminster and Spencer Jones Rd
- 214 Olde Mill Ct
- 12941 N Anderson Rd
- 3 Westminster and Spencer Jones Rd
- 2 Westminster and Spencer Jones Rd
- 1 Westminster and Spencer Jones Rd
- 7901 Azoo St
- 10025 N Ruth St
- 0 Post and Ruth Rd Unit 1193419
- 8420 Joan St
- 9290 N Hiwassee Rd
- 12724 Abundance St
- 0 Shady Oak Ln Unit 6 981932
- 0 Shady Oak Ln Unit 5 981931
- 0 Shady Oak Ln Unit 4 981929
- 0 Shady Oak Ln Unit 3 981927
- 0 Shady Oak Ln Unit 2 981924
- 0 Shady Oak Ln Unit 1 981920
- 0 Shady Oak Ln
- 11229 Heatherwood Dr
- 11333 Heatherwood Dr
- 10200 N Westminster Rd
- 00 N Westminster Rd
- 10000 N Westminster Rd
- 11424 Heatherwood Dr
- 10612 N Westminster Rd
- 9820 N Westminster Rd
- 10301 N Westminster Rd
- 10500 N Westminster Ln
- 10101 N Westminster Rd
- 11329 Meadow Ridge Ln
- 000 N 00 Westminster Rd