Estimated Value: $607,000 - $707,000
5
Beds
3
Baths
2,865
Sq Ft
$229/Sq Ft
Est. Value
About This Home
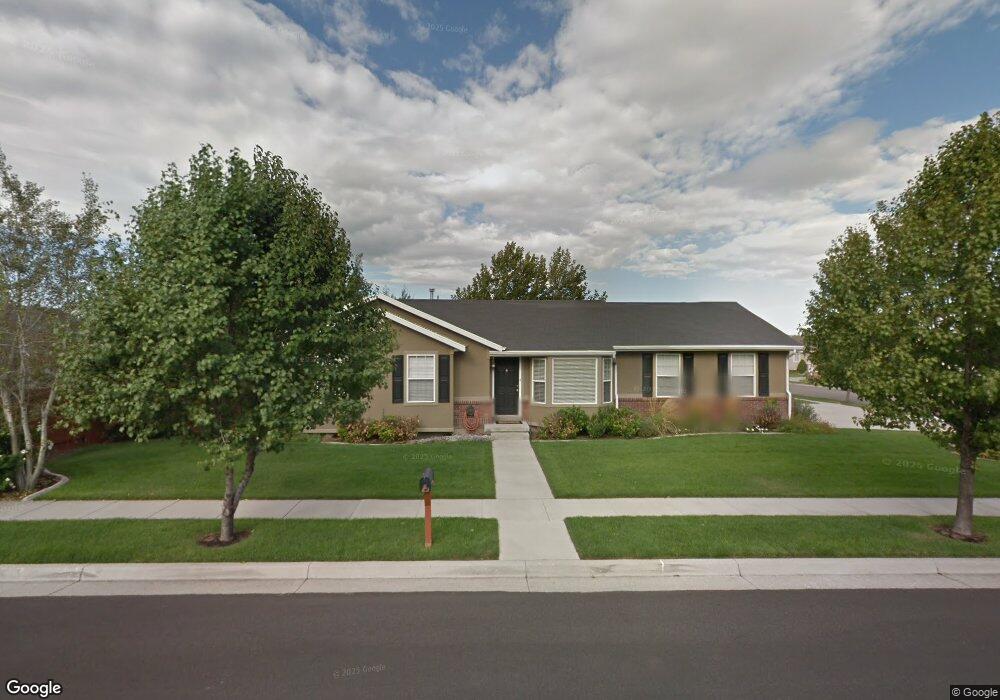
This home is located at 11302 Glen Croft Ln, Sandy, UT 84070 and is currently estimated at $656,061, approximately $228 per square foot. 11302 Glen Croft Ln is a home located in Salt Lake County with nearby schools including Crescent School, Mount Jordan Middle School, and St John the Baptist Catholic Elementary School.
Ownership History
Date
Name
Owned For
Owner Type
Purchase Details
Closed on
Jun 7, 2013
Sold by
Kjar Kimball and Kjar Chesney
Bought by
Osoro Julie
Current Estimated Value
Home Financials for this Owner
Home Financials are based on the most recent Mortgage that was taken out on this home.
Original Mortgage
$274,500
Outstanding Balance
$194,216
Interest Rate
3.37%
Mortgage Type
New Conventional
Estimated Equity
$461,845
Purchase Details
Closed on
May 31, 2007
Sold by
Johns Carli S and Johns Jason
Bought by
Kjar Kimball and Kjar Chesney
Home Financials for this Owner
Home Financials are based on the most recent Mortgage that was taken out on this home.
Original Mortgage
$332,400
Interest Rate
6.14%
Mortgage Type
New Conventional
Purchase Details
Closed on
Aug 7, 2006
Sold by
Johns Carli S
Bought by
Johns Jason and Johns Carli S
Home Financials for this Owner
Home Financials are based on the most recent Mortgage that was taken out on this home.
Original Mortgage
$85,000
Interest Rate
6.33%
Mortgage Type
New Conventional
Purchase Details
Closed on
Mar 18, 2004
Sold by
Johns Jason R and Johns Carli S
Bought by
Johns Carli S
Home Financials for this Owner
Home Financials are based on the most recent Mortgage that was taken out on this home.
Original Mortgage
$135,000
Interest Rate
4.96%
Mortgage Type
New Conventional
Purchase Details
Closed on
Dec 10, 2003
Sold by
Neff A Robert
Bought by
Anderson Jerry Dean and Anderson Glenys Y
Purchase Details
Closed on
Jul 31, 1998
Sold by
Neff Construction Inc
Bought by
Johns Jason R and Johns Carli S
Home Financials for this Owner
Home Financials are based on the most recent Mortgage that was taken out on this home.
Original Mortgage
$131,900
Interest Rate
6.9%
Purchase Details
Closed on
Mar 19, 1998
Sold by
Anderson Jerry Dean and Anderson Glenys Y
Bought by
Neff Construction Inc
Home Financials for this Owner
Home Financials are based on the most recent Mortgage that was taken out on this home.
Original Mortgage
$130,000
Interest Rate
7.02%
Purchase Details
Closed on
Mar 10, 1998
Sold by
Neff A Robert
Bought by
Neff Construction Inc
Home Financials for this Owner
Home Financials are based on the most recent Mortgage that was taken out on this home.
Original Mortgage
$130,000
Interest Rate
7.02%
Create a Home Valuation Report for This Property
The Home Valuation Report is an in-depth analysis detailing your home's value as well as a comparison with similar homes in the area
Home Values in the Area
Average Home Value in this Area
Purchase History
| Date | Buyer | Sale Price | Title Company |
|---|---|---|---|
| Osoro Julie | -- | Title One | |
| Kjar Kimball | -- | Inwest Title Services | |
| Johns Jason | -- | Fidelity National Title | |
| Johns Carli S | -- | Inwest Title Services | |
| Anderson Jerry Dean | -- | Backman Stewart Title Svcs | |
| Johns Jason R | -- | -- | |
| Neff Construction Inc | -- | -- | |
| Neff Construction Inc | -- | -- |
Source: Public Records
Mortgage History
| Date | Status | Borrower | Loan Amount |
|---|---|---|---|
| Open | Osoro Julie | $274,500 | |
| Previous Owner | Kjar Kimball | $332,400 | |
| Previous Owner | Johns Jason | $85,000 | |
| Previous Owner | Johns Carli S | $135,000 | |
| Previous Owner | Johns Jason R | $131,900 | |
| Previous Owner | Neff Construction Inc | $130,000 | |
| Closed | Johns Carli S | $45,000 |
Source: Public Records
Tax History Compared to Growth
Tax History
| Year | Tax Paid | Tax Assessment Tax Assessment Total Assessment is a certain percentage of the fair market value that is determined by local assessors to be the total taxable value of land and additions on the property. | Land | Improvement |
|---|---|---|---|---|
| 2025 | $3,237 | $630,200 | $160,400 | $469,800 |
| 2024 | $3,237 | $610,600 | $147,200 | $463,400 |
| 2023 | $3,144 | $592,600 | $139,900 | $452,700 |
| 2022 | $3,142 | $579,000 | $137,200 | $441,800 |
| 2021 | $2,634 | $413,200 | $117,600 | $295,600 |
| 2020 | $2,545 | $377,000 | $107,800 | $269,200 |
| 2019 | $2,250 | $359,500 | $107,800 | $251,700 |
| 2018 | $2,287 | $345,800 | $107,800 | $238,000 |
| 2017 | $2,294 | $332,000 | $102,900 | $229,100 |
| 2016 | $2,283 | $319,600 | $102,900 | $216,700 |
| 2015 | $2,250 | $291,900 | $99,800 | $192,100 |
| 2014 | $2,196 | $279,900 | $96,700 | $183,200 |
Source: Public Records
Map
Nearby Homes
- 11296 Hidden View Dr Unit 239
- 478 E Meadow Hill Dr
- 275 E Crescent Park Way Unit 158
- 264 E Jordan View Dr Unit 157
- 262 Hidden View Dr Unit 94
- 11273 Jordan Meadow Ln Unit 205
- 244 E Crescent Pkwy S Unit 206
- 208 Crescentwood Dr
- 11259 S Crescent Park Cir Unit 172
- 11533 S Berryknoll Cir
- 409 E 11000 S
- 517 E 11000 S
- 11594 S Tuscan View Ct Unit 8
- 11075 S Grape Arbor Place Unit 206
- 11686 S Mapleberry Ct
- 11143 Sandy Dunes Dr
- 11035 S Grapevine Cove Unit 204
- 11025 S Grapevine Cove Unit B205
- 670 Wyngate Pointe Ln
- 11737 S Nigel Peak Ln
- 11302 S Glen Croft Ln
- 348 Jerand Way
- 357 La Vera Ln
- 357 E La Vera Ln
- 347 E La Vera Ln
- 347 La Vera Ln
- 355 Jerand Way
- 11303 Glen Croft Ln
- 11291 Glen Croft Ln
- 336 Jerand Way
- 336 E Jerand Way
- 11317 S Glen Croft Ln
- 341 La Vera Ln
- 341 E La Vera Ln
- 11279 S Glen Croft Ln
- 11279 Glen Croft Ln
- 341 Jerand Way
- 329 Jerand Way
- 11266 Glen Croft Ln
- 11331 Glen Croft Ln