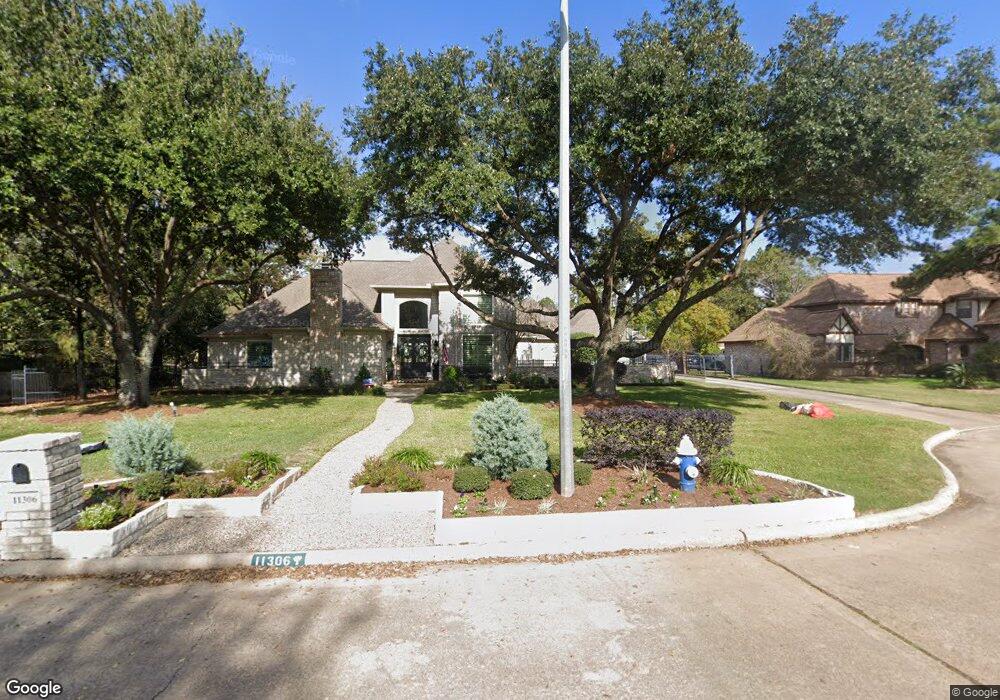
11306 Spring Glen Dr Houston, TX 77070
Estimated Value: $642,000 - $730,000
4
Beds
4
Baths
4,000
Sq Ft
$169/Sq Ft
Est. Value
About This Home
This home is located at 11306 Spring Glen Dr, Houston, TX 77070 and is currently estimated at $675,188, approximately $168 per square foot. 11306 Spring Glen Dr is a home located in Harris County with nearby schools including Lakewood Elementary School, Willow Wood Junior High School, and Northpointe Intermediate School.
Ownership History
Date
Name
Owned For
Owner Type
Purchase Details
Closed on
Aug 14, 2025
Sold by
Williams Greg and Williams Jamie
Bought by
Greg & Jamie Williams Family Trust and Williams
Current Estimated Value
Purchase Details
Closed on
Jul 29, 2019
Sold by
Peltier Arthur M and Peltier Susan G
Bought by
Williams Greg and Williams Jamie
Purchase Details
Closed on
Oct 23, 2014
Sold by
Christopher Carl
Bought by
Peltier Arthur M and Peltier Suan G
Purchase Details
Closed on
Feb 4, 2014
Sold by
Kaufman Mary Josephine
Bought by
Kaufman Carl Christopher
Purchase Details
Closed on
May 8, 2007
Sold by
Kaufman Carl Christopher
Bought by
Kaufman Mary Josephine
Create a Home Valuation Report for This Property
The Home Valuation Report is an in-depth analysis detailing your home's value as well as a comparison with similar homes in the area
Home Values in the Area
Average Home Value in this Area
Purchase History
| Date | Buyer | Sale Price | Title Company |
|---|---|---|---|
| Greg & Jamie Williams Family Trust | -- | None Listed On Document | |
| Williams Greg | -- | Alamo Title Company | |
| Peltier Arthur M | -- | Charter Title Co | |
| Kaufman Carl Christopher | -- | None Available | |
| Kaufman Mary Josephine | -- | None Available |
Source: Public Records
Mortgage History
| Date | Status | Borrower | Loan Amount |
|---|---|---|---|
| Closed | Kaufman Mary Josephine | $0 |
Source: Public Records
Tax History Compared to Growth
Tax History
| Year | Tax Paid | Tax Assessment Tax Assessment Total Assessment is a certain percentage of the fair market value that is determined by local assessors to be the total taxable value of land and additions on the property. | Land | Improvement |
|---|---|---|---|---|
| 2025 | $10,980 | $634,024 | $114,802 | $519,222 |
| 2024 | $10,980 | $593,679 | $98,556 | $495,123 |
| 2023 | $10,980 | $590,139 | $93,141 | $496,998 |
| 2022 | $12,295 | $540,720 | $84,477 | $456,243 |
| 2021 | $11,792 | $472,724 | $64,982 | $407,742 |
| 2020 | $11,640 | $449,541 | $64,982 | $384,559 |
| 2019 | $10,477 | $394,000 | $64,982 | $329,018 |
| 2018 | $5,112 | $406,500 | $64,982 | $341,518 |
| 2017 | $10,791 | $406,500 | $64,982 | $341,518 |
| 2016 | $10,791 | $406,500 | $64,982 | $341,518 |
| 2015 | $5,178 | $405,645 | $64,982 | $340,663 |
| 2014 | $5,178 | $309,261 | $64,982 | $244,279 |
Source: Public Records
Map
Nearby Homes
- 11410 Rothglen St
- 15206 Beacham Dr
- 12 Lakeview Place
- 15118 Stillcreek Dr
- 11614 Brookfalls Dr
- 11707 Hillbrook Dr
- 14907 Pine Point Ct
- 11715 Park Creek Dr
- 15102 Rolling Oaks Dr
- 11502 Primwood Dr
- 11723 Quail Creek Dr
- 15603 Canterbury Forest Dr
- 15418 Waldwick Dr
- 11814 Golden Pine Dr
- 15014 River Park Dr
- 11807 Primwood Dr
- 15627 Lago Villa Dr
- 11803 Pebbleton Dr
- 15522 Waldwick Dr
- 15603 Lakewood Terrace Dr
- 11302 Spring Glen Dr Unit FF3201
- 11335 Bassdale Dr
- 11339 Bassdale Dr
- 11307 Spring Glen Dr
- 11303 Spring Glen Dr
- 15203 Jones Rd
- 15119 Jones Rd
- 11403 Bassdale Dr
- 15207 Jones Rd
- 15115 Jones Rd
- 11314 Bassdale Dr
- 11318 Bassdale Dr
- 11310 Bassdale Dr
- 11326 Bassdale Dr
- 11330 Bassdale Dr
- 11334 Bassdale Dr
- 15111 Jones Rd
- 11338 Bassdale Dr
- 11342 Bassdale Dr
- 11302 Bassdale Dr