Estimated Value: $594,000 - $645,000
3
Beds
2
Baths
2,156
Sq Ft
$283/Sq Ft
Est. Value
About This Home
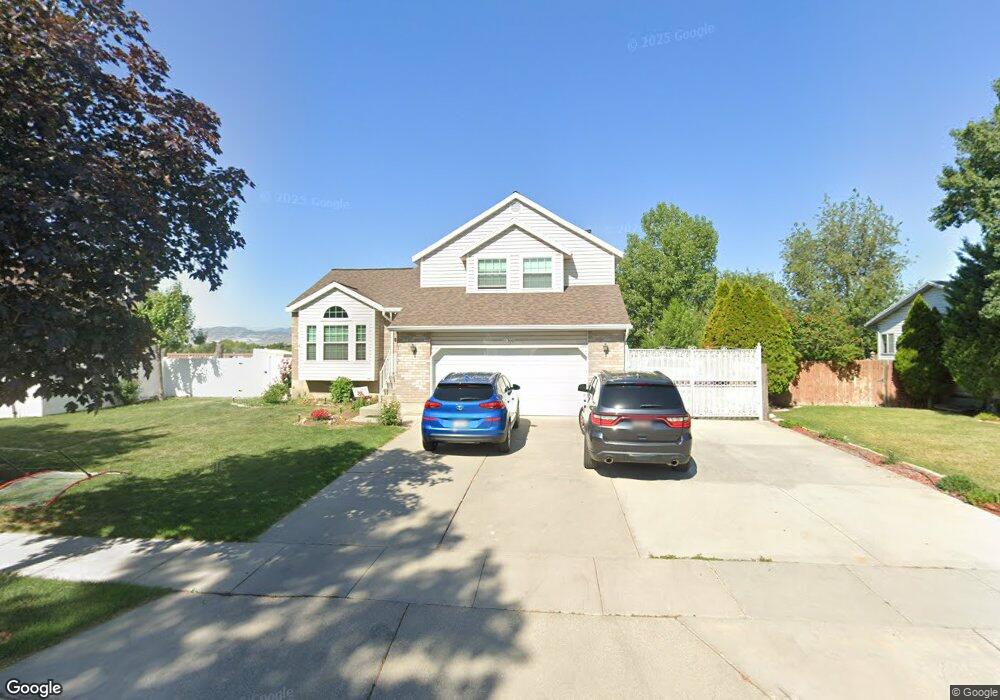
This home is located at 11308 Ohenry Rd E, Sandy, UT 84070 and is currently estimated at $609,238, approximately $282 per square foot. 11308 Ohenry Rd E is a home located in Salt Lake County with nearby schools including Altara Elementary School, St John the Baptist Catholic Elementary School, and St. John the Baptist Catholic Middle School.
Ownership History
Date
Name
Owned For
Owner Type
Purchase Details
Closed on
Nov 10, 2022
Sold by
Kaihau Marjorie Huey
Bought by
Marjorie Kaihau Family Trust
Current Estimated Value
Purchase Details
Closed on
Jul 31, 2001
Sold by
Call Jeanette
Bought by
Kaihau Viliami A and Kaihau Marjorie Huey
Home Financials for this Owner
Home Financials are based on the most recent Mortgage that was taken out on this home.
Original Mortgage
$132,000
Interest Rate
7.1%
Purchase Details
Closed on
Nov 20, 1995
Sold by
Young Rod and Young Amanda
Bought by
Call Jeanette
Home Financials for this Owner
Home Financials are based on the most recent Mortgage that was taken out on this home.
Original Mortgage
$105,000
Interest Rate
7.51%
Create a Home Valuation Report for This Property
The Home Valuation Report is an in-depth analysis detailing your home's value as well as a comparison with similar homes in the area
Home Values in the Area
Average Home Value in this Area
Purchase History
| Date | Buyer | Sale Price | Title Company |
|---|---|---|---|
| Marjorie Kaihau Family Trust | -- | -- | |
| Kaihau Viliami A | -- | Superior Title Company | |
| Call Jeanette | -- | -- |
Source: Public Records
Mortgage History
| Date | Status | Borrower | Loan Amount |
|---|---|---|---|
| Previous Owner | Kaihau Viliami A | $132,000 | |
| Previous Owner | Call Jeanette | $105,000 |
Source: Public Records
Tax History
| Year | Tax Paid | Tax Assessment Tax Assessment Total Assessment is a certain percentage of the fair market value that is determined by local assessors to be the total taxable value of land and additions on the property. | Land | Improvement |
|---|---|---|---|---|
| 2025 | $2,532 | $512,400 | $152,300 | $360,100 |
| 2024 | $2,532 | $477,700 | $142,000 | $335,700 |
| 2023 | $2,526 | $476,100 | $134,900 | $341,200 |
| 2022 | $2,663 | $490,600 | $132,300 | $358,300 |
| 2021 | $2,245 | $352,200 | $112,700 | $239,500 |
| 2020 | $2,153 | $318,900 | $102,900 | $216,000 |
| 2019 | $2,056 | $297,200 | $102,900 | $194,300 |
| 2018 | $1,865 | $282,000 | $102,900 | $179,100 |
| 2017 | $1,869 | $270,500 | $93,200 | $177,300 |
| 2016 | $1,806 | $252,800 | $93,200 | $159,600 |
| 2015 | $1,764 | $228,800 | $90,400 | $138,400 |
| 2014 | $1,710 | $218,000 | $87,600 | $130,400 |
Source: Public Records
Map
Nearby Homes
- 584 E Camden Pointe Cove
- 11344 S Abbotts Ford Ln
- 414 Cranberry Hill Dr
- 392 Cranberry Hill Dr
- 11243 Hidden View Dr Unit 122
- 276 E Hidden View Dr Unit 98
- 272 Hidden View Dr Unit 97
- 11310 S 265 E Unit 217
- 11290 S 265 E Unit 212
- 262 Hidden View Dr Unit 94
- 11265 S Crescent Park Cir
- 221 E Jordan View Dr
- 11085 S Grape Arbor Place Unit 102
- 11362 S Crescent Park Cir Unit 8
- 604 Normandy Loop Ln
- 11035 S Grapevine Cove Unit 204
- 11228 S Jordan View Dr Unit 27
- 654 Wyngate Pointe Ln
- 178 Belle Glenn Cir
- 11544 Olive Berry Ln
- 11308 Ohenry Rd
- 11294 Ohenry Rd
- 11294 Ohenry Rd E
- 11322 Ohenry Rd
- 11322 S Ohenry Rd
- 11284 Ohenry Rd
- 11307 Ohenry Rd
- 11307 S Ohenry Rd
- 11334 S Ohenry Rd
- 11334 Ohenry Rd
- 11295 S Ohenry Rd
- 11295 Ohenry Rd
- 467 E Montana Dr
- 467 Montana Dr
- 11270 S Ohenry Rd Unit B
- 11270 S Ohenry Rd
- 11270 Ohenry Rd
- 11348 Ohenry Rd
- 11348 Ohenry Rd E
- 477 Montana Dr
Your Personal Tour Guide
Ask me questions while you tour the home.