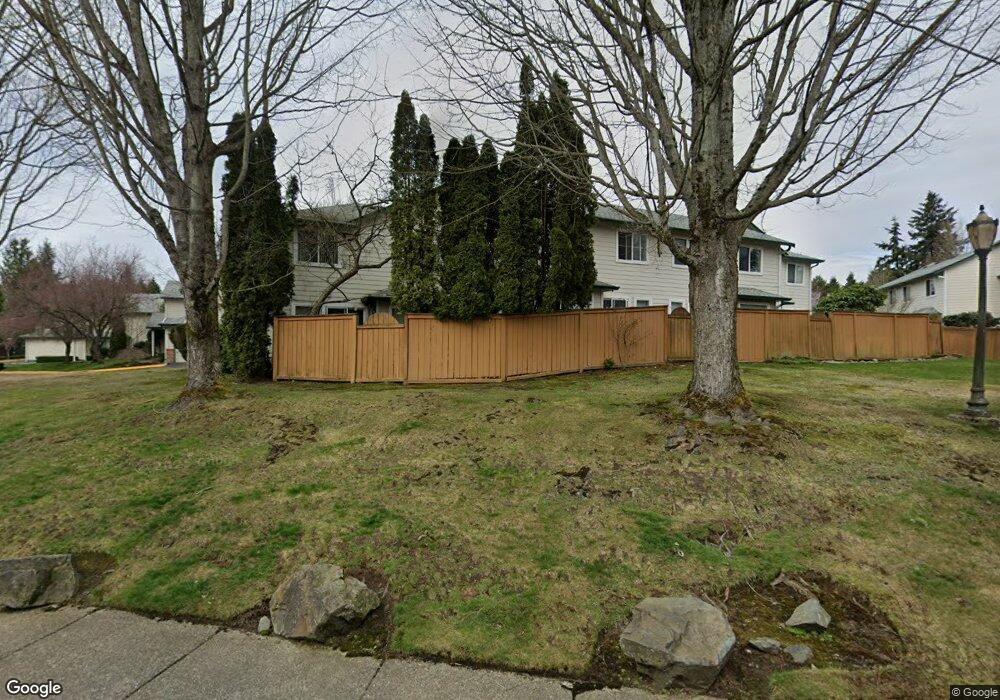
1131 115th St SW Unit J2 Everett, WA 98204
Paine Field-Lake Stickney NeighborhoodEstimated Value: $494,292 - $511,000
3
Beds
3
Baths
2,748
Sq Ft
$183/Sq Ft
Est. Value
About This Home
This home is located at 1131 115th St SW Unit J2, Everett, WA 98204 and is currently estimated at $503,073, approximately $183 per square foot. 1131 115th St SW Unit J2 is a home located in Snohomish County with nearby schools including Olivia Park Elementary School, Voyager Middle School, and Mariner High School.
Ownership History
Date
Name
Owned For
Owner Type
Purchase Details
Closed on
May 7, 2002
Sold by
Mortenson Kristin
Bought by
Mortenson Gregory D
Current Estimated Value
Home Financials for this Owner
Home Financials are based on the most recent Mortgage that was taken out on this home.
Original Mortgage
$157,650
Outstanding Balance
$67,739
Interest Rate
7.18%
Mortgage Type
FHA
Estimated Equity
$435,334
Purchase Details
Closed on
Nov 22, 1995
Sold by
Thomas Cassie Ann and Butcher Cassie
Bought by
Thomas Cassie Ann
Home Financials for this Owner
Home Financials are based on the most recent Mortgage that was taken out on this home.
Original Mortgage
$117,550
Interest Rate
7.42%
Mortgage Type
FHA
Purchase Details
Closed on
Nov 7, 1994
Sold by
Metco Construction Inc
Bought by
Butcher Cassie
Home Financials for this Owner
Home Financials are based on the most recent Mortgage that was taken out on this home.
Original Mortgage
$111,550
Interest Rate
8.9%
Mortgage Type
FHA
Create a Home Valuation Report for This Property
The Home Valuation Report is an in-depth analysis detailing your home's value as well as a comparison with similar homes in the area
Home Values in the Area
Average Home Value in this Area
Purchase History
| Date | Buyer | Sale Price | Title Company |
|---|---|---|---|
| Mortenson Gregory D | -- | -- | |
| Mortenson Gregory D | $162,500 | -- | |
| Thomas Cassie Ann | -- | Chicago Title Insurance Co | |
| Butcher Cassie | $114,990 | -- |
Source: Public Records
Mortgage History
| Date | Status | Borrower | Loan Amount |
|---|---|---|---|
| Open | Mortenson Gregory D | $157,650 | |
| Previous Owner | Thomas Cassie Ann | $117,550 | |
| Previous Owner | Butcher Cassie | $111,550 |
Source: Public Records
Tax History Compared to Growth
Tax History
| Year | Tax Paid | Tax Assessment Tax Assessment Total Assessment is a certain percentage of the fair market value that is determined by local assessors to be the total taxable value of land and additions on the property. | Land | Improvement |
|---|---|---|---|---|
| 2025 | $3,830 | $451,000 | $62,500 | $388,500 |
| 2024 | $3,830 | $446,500 | $60,500 | $386,000 |
| 2023 | $3,383 | $409,500 | $53,000 | $356,500 |
| 2022 | $3,083 | $315,000 | $47,000 | $268,000 |
| 2020 | $2,988 | $300,000 | $44,000 | $256,000 |
| 2019 | $2,601 | $261,000 | $35,500 | $225,500 |
| 2018 | $2,725 | $239,000 | $35,500 | $203,500 |
| 2017 | $2,297 | $205,000 | $31,000 | $174,000 |
| 2016 | $2,094 | $185,000 | $29,500 | $155,500 |
| 2015 | $2,136 | $173,000 | $29,000 | $144,000 |
| 2013 | $1,949 | $147,500 | $29,000 | $118,500 |
Source: Public Records
Map
Nearby Homes
- 1131 115th St SW Unit J3
- 1131 115th St SW Unit M2
- 1131 115th St SW Unit E4
- 1120 113th St SW
- 11626 Admiralty Way Unit A
- 11527 Hwy 99 Unit C106
- 11527 Highway 99 Unit B303
- 11527 Highway 99 Unit C102
- 900 116th St SW
- 11415 8th Place W Unit D
- 11330 8th Place W Unit B
- 725 115th St SW Unit BB204
- 723 114th St SW Unit Y203
- 730 112th St SW Unit I4
- 11907 Admiralty Way
- 729 112th St SW Unit G3
- 729 112th St SW Unit G-1
- 11121 7th Place W Unit D
- 14000 Center Rd
- 24 XX Center Rd
- 1131 115th St SW
- 1131 115th St SW Unit 4
- 1131 115th St SW Unit 3
- 1131 115th St SW Unit 2
- 1131 115th St SW Unit O1
- 1131 115th St SW Unit N4
- 1131 115th St SW Unit N3
- 1131 115th St SW Unit N2
- 1131 115th St SW Unit N1
- 1131 115th St SW Unit M4
- 1131 115th St SW Unit M3
- 1131 115th St SW Unit M1
- 1131 115th St SW Unit L4
- 1131 115th St SW Unit L3
- 1131 115th St SW Unit L2
- 1131 115th St SW Unit L1
- 1131 115th St SW Unit K4
- 1131 115th St SW Unit K2
- 1131 115th St SW Unit K1
- 1131 115th St SW Unit J4