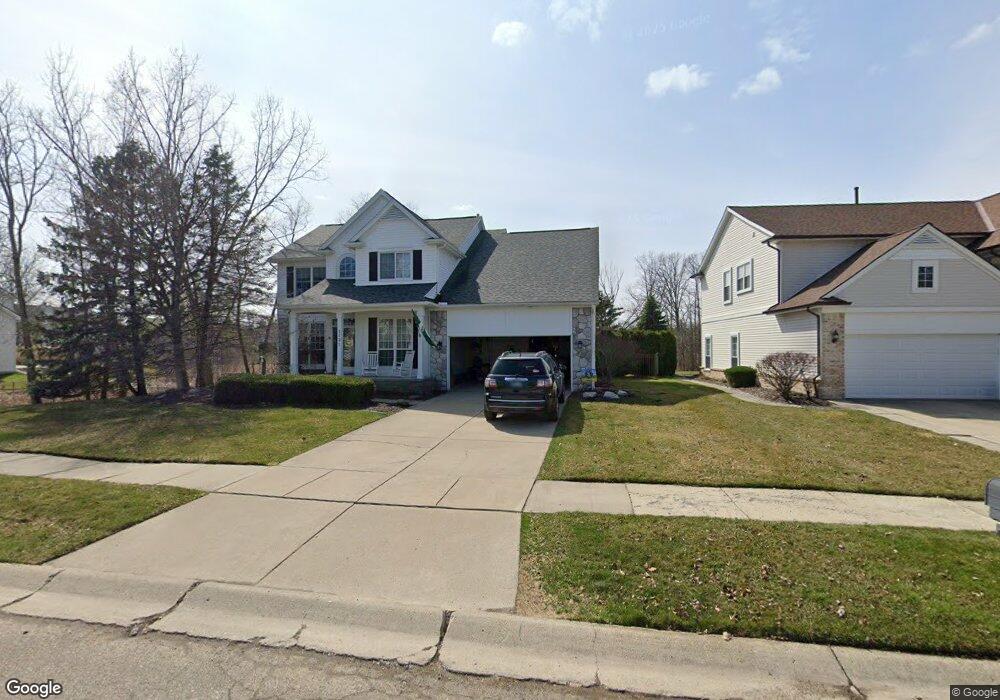
1131 Chestnut Ln Unit 104 South Lyon, MI 48178
Estimated Value: $510,000 - $589,000
4
Beds
3
Baths
2,552
Sq Ft
$209/Sq Ft
Est. Value
About This Home
This home is located at 1131 Chestnut Ln Unit 104, South Lyon, MI 48178 and is currently estimated at $533,884, approximately $209 per square foot. 1131 Chestnut Ln Unit 104 is a home located in Oakland County with nearby schools including Frank E. Bartlett School, Centennial Middle School, and South Lyon High School.
Ownership History
Date
Name
Owned For
Owner Type
Purchase Details
Closed on
May 13, 2009
Sold by
Fifth Third Mortgage Company
Bought by
Federal National Mortgage Association
Current Estimated Value
Purchase Details
Closed on
May 12, 2009
Sold by
Cook Sanford E and Cook Ann M
Bought by
Fifth Third Mortgage Company
Purchase Details
Closed on
Oct 25, 2004
Sold by
Meabrod Tara M
Bought by
Cook Standford E
Home Financials for this Owner
Home Financials are based on the most recent Mortgage that was taken out on this home.
Original Mortgage
$272,000
Interest Rate
5.67%
Mortgage Type
Fannie Mae Freddie Mac
Purchase Details
Closed on
Sep 27, 2002
Sold by
Collins Lloyd T and Collins Nancy
Bought by
Meabrod Tara M
Purchase Details
Closed on
Sep 30, 1998
Sold by
Silverman Building Co In
Bought by
Collins Lloyd T
Purchase Details
Closed on
May 28, 1998
Sold by
Demaria Investments
Bought by
Silverman Building Co Inc
Create a Home Valuation Report for This Property
The Home Valuation Report is an in-depth analysis detailing your home's value as well as a comparison with similar homes in the area
Home Values in the Area
Average Home Value in this Area
Purchase History
| Date | Buyer | Sale Price | Title Company |
|---|---|---|---|
| Federal National Mortgage Association | -- | None Available | |
| Fifth Third Mortgage Company | $280,873 | None Available | |
| Cook Standford E | $338,700 | First American Title | |
| Meabrod Tara M | $318,000 | -- | |
| Collins Lloyd T | $258,022 | -- | |
| Silverman Building Co Inc | $48,007 | -- |
Source: Public Records
Mortgage History
| Date | Status | Borrower | Loan Amount |
|---|---|---|---|
| Previous Owner | Cook Standford E | $272,000 |
Source: Public Records
Tax History Compared to Growth
Tax History
| Year | Tax Paid | Tax Assessment Tax Assessment Total Assessment is a certain percentage of the fair market value that is determined by local assessors to be the total taxable value of land and additions on the property. | Land | Improvement |
|---|---|---|---|---|
| 2024 | $5,329 | $206,410 | $0 | $0 |
| 2023 | $5,000 | $190,710 | $0 | $0 |
| 2022 | $4,832 | $174,960 | $0 | $0 |
| 2021 | $4,598 | $168,890 | $0 | $0 |
| 2020 | $4,456 | $166,320 | $0 | $0 |
| 2019 | $4,555 | $163,350 | $0 | $0 |
| 2018 | $4,437 | $152,160 | $0 | $0 |
| 2017 | $4,459 | $150,880 | $0 | $0 |
| 2016 | $4,419 | $144,420 | $0 | $0 |
| 2015 | -- | $137,980 | $0 | $0 |
| 2014 | -- | $122,850 | $0 | $0 |
| 2011 | -- | $97,360 | $0 | $0 |
Source: Public Records
Map
Nearby Homes
- 1090 Shetland Dr Unit 340
- 1189 Colt Dr
- 62180 Arlington Cir Unit 5
- 61961 Yorktown Dr Unit 4
- 62072 Yorktown Dr
- 6040 Fieldstone Cir
- 61958 Ticonderoga Dr
- 62512 Raleigh Ct Unit 4
- 25861 Lexington Dr Unit 1
- 61116 Greenwood Dr Unit 5
- 61049 Greenwood Dr
- 61137 Greenwood Dr
- 61009 Greenwood Dr Unit 183
- 61051 Greenwood Dr
- 61264 Greenwood Dr Unit 77
- 61011 Greenwood Dr
- 1089 Gallop Ln Unit 181
- 25325 Potomac Dr Unit 3
- 25323 Potomac Dr Unit 2
- 25664 Lexington Dr Unit 2
- 1125 Chestnut Ln
- 1137 Chestnut Ln Unit Bldg-Unit
- 1137 Chestnut Ln
- 1119 Chestnut Ln Unit 106
- 1158 Chestnut Ln Unit 138
- 1164 Chestnut Ln
- 1143 Chestnut Ln
- 1113 Chestnut Ln
- 1170 Chestnut Ln Unit 140
- 1152 Chestnut Ln
- 1107 Chestnut Ln
- 1146 Chestnut Ln
- 1176 Chestnut Ln
- 1140 Chestnut Ln Unit 135
- 1092 Colt Dr
- 1086 Colt Dr Unit 46
- 1030 Shetland Dr Unit 40
- 1104 Colt Dr Unit 43
- 1035 Arabian Ct Unit 50
- 1182 Chestnut Ln