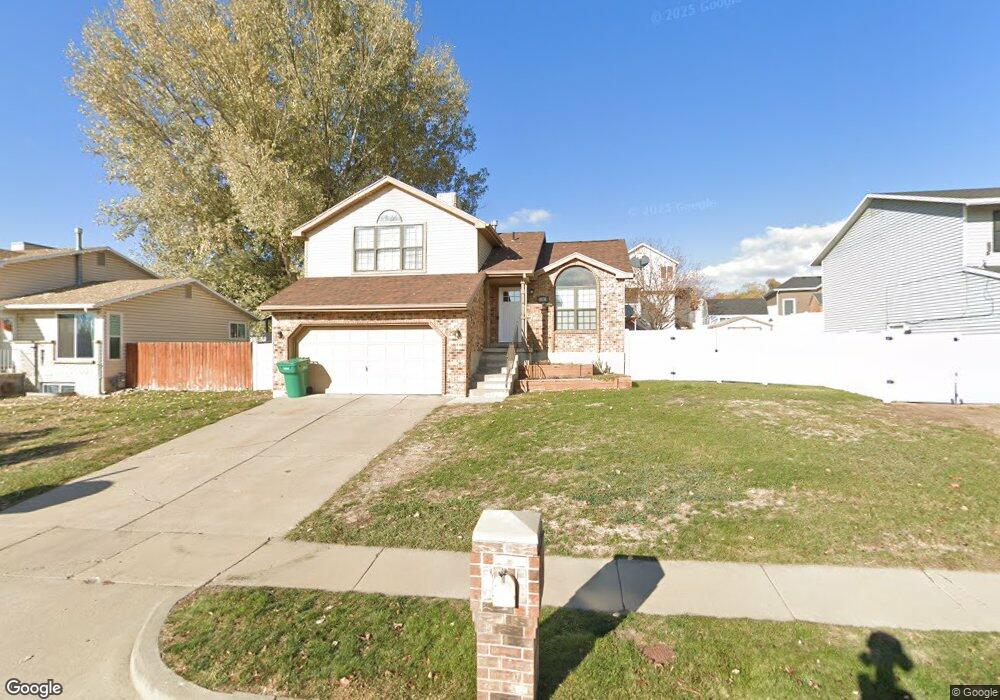
1131 E 2450 N Layton, UT 84040
Estimated Value: $458,063 - $502,000
4
Beds
3
Baths
1,742
Sq Ft
$272/Sq Ft
Est. Value
About This Home
This home is located at 1131 E 2450 N, Layton, UT 84040 and is currently estimated at $474,516, approximately $272 per square foot. 1131 E 2450 N is a home located in Davis County with nearby schools including Sarah Jane Adams Elementary School, North Layton Junior High School, and Northridge High School.
Ownership History
Date
Name
Owned For
Owner Type
Purchase Details
Closed on
Feb 25, 2006
Sold by
Blue Keyes Gayle C and Keyes Anthony
Bought by
York Wesley
Current Estimated Value
Home Financials for this Owner
Home Financials are based on the most recent Mortgage that was taken out on this home.
Original Mortgage
$31,900
Outstanding Balance
$17,831
Interest Rate
6.08%
Mortgage Type
Stand Alone Second
Estimated Equity
$456,685
Purchase Details
Closed on
Sep 21, 2001
Sold by
Blue Keyes Gayle C and Keyes Anthony C
Bought by
Blue Keyes Gayle C and Keyes Anthony
Home Financials for this Owner
Home Financials are based on the most recent Mortgage that was taken out on this home.
Original Mortgage
$125,784
Interest Rate
6.91%
Mortgage Type
FHA
Purchase Details
Closed on
Dec 30, 1999
Sold by
Blue Keyes Gayle C
Bought by
Keyes Anthony C and Blue Keyes Gayle C
Create a Home Valuation Report for This Property
The Home Valuation Report is an in-depth analysis detailing your home's value as well as a comparison with similar homes in the area
Home Values in the Area
Average Home Value in this Area
Purchase History
| Date | Buyer | Sale Price | Title Company |
|---|---|---|---|
| York Wesley | -- | Founders Title Company | |
| Blue Keyes Gayle C | -- | Founders Title Co | |
| Keyes Anthony C | -- | First American Title Co | |
| Blue Keyes Gayle C | -- | Backman Stewart Title Servic |
Source: Public Records
Mortgage History
| Date | Status | Borrower | Loan Amount |
|---|---|---|---|
| Open | York Wesley | $31,900 | |
| Open | York Wesley | $127,600 | |
| Previous Owner | Blue Keyes Gayle C | $125,784 |
Source: Public Records
Tax History
| Year | Tax Paid | Tax Assessment Tax Assessment Total Assessment is a certain percentage of the fair market value that is determined by local assessors to be the total taxable value of land and additions on the property. | Land | Improvement |
|---|---|---|---|---|
| 2025 | $2,180 | $228,800 | $95,960 | $132,840 |
| 2024 | $2,185 | $231,000 | $123,812 | $107,188 |
| 2023 | $2,157 | $402,000 | $177,611 | $224,389 |
| 2022 | $2,266 | $229,350 | $94,307 | $135,043 |
| 2021 | $2,093 | $316,000 | $142,004 | $173,996 |
| 2020 | $1,892 | $274,000 | $109,119 | $164,881 |
| 2019 | $1,713 | $243,000 | $98,718 | $144,282 |
| 2018 | $1,552 | $221,000 | $54,572 | $166,428 |
| 2016 | $1,440 | $105,765 | $29,225 | $76,540 |
| 2015 | $1,370 | $95,535 | $29,225 | $66,310 |
| 2014 | $1,289 | $91,877 | $29,225 | $62,652 |
| 2013 | -- | $93,595 | $20,701 | $72,894 |
Source: Public Records
Map
Nearby Homes
- 2315 N 1075 E
- 1444 E 2400 N
- 1120 E 2200 N
- 1447 E 2700 N
- 1099 E 2125 N
- 948 E Hercules Ct Unit 179
- 3142 E Thorley Dr
- 3138 E Thorley Dr
- 2096 N 1450 E
- 2826 N 1600 E
- 1465 E Sego Lily Ct
- 1540 E Primrose Ln
- 1241 E 3075 N
- 1266 E 3125 N
- 1731 E 2825 N
- 1785 E 2825 N
- 2189 N 1950 E
- 1321 E 3125 N
- 1305 E Larkspur Way
- 935 E 3000 N Unit 183
Your Personal Tour Guide
Ask me questions while you tour the home.