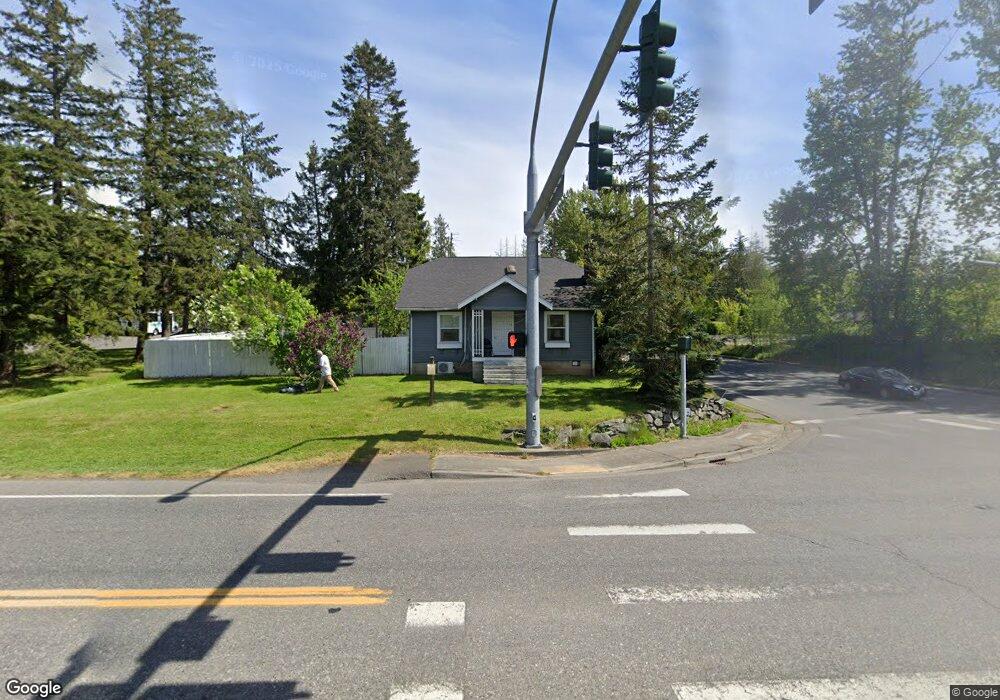
1131 Mt Baker Hwy Bellingham, WA 98226
Barkley NeighborhoodEstimated Value: $545,000 - $656,000
3
Beds
2
Baths
1,338
Sq Ft
$444/Sq Ft
Est. Value
About This Home
This home is located at 1131 Mt Baker Hwy, Bellingham, WA 98226 and is currently estimated at $593,541, approximately $443 per square foot. 1131 Mt Baker Hwy is a home located in Whatcom County with nearby schools including Northern Heights Elementary School, Shuksan Middle School, and Squalicum High School.
Ownership History
Date
Name
Owned For
Owner Type
Purchase Details
Closed on
Jun 4, 2021
Sold by
Patton Medina Susanne E
Bought by
Medina Victor and Patton Medina Susanne
Current Estimated Value
Home Financials for this Owner
Home Financials are based on the most recent Mortgage that was taken out on this home.
Original Mortgage
$367,500
Outstanding Balance
$332,725
Interest Rate
2.9%
Mortgage Type
New Conventional
Estimated Equity
$260,816
Purchase Details
Closed on
Mar 26, 2018
Sold by
Medina Victor and Patton Medina Susanne E
Bought by
Patton Medina Susanne E
Home Financials for this Owner
Home Financials are based on the most recent Mortgage that was taken out on this home.
Original Mortgage
$243,470
Interest Rate
4.38%
Mortgage Type
New Conventional
Purchase Details
Closed on
Jul 3, 2015
Sold by
Litten Richard W
Bought by
Litten Rita M
Create a Home Valuation Report for This Property
The Home Valuation Report is an in-depth analysis detailing your home's value as well as a comparison with similar homes in the area
Home Values in the Area
Average Home Value in this Area
Purchase History
| Date | Buyer | Sale Price | Title Company |
|---|---|---|---|
| Medina Victor | -- | Chicago Title Company Of Wa | |
| Patton Medina Susanne E | -- | Whatcom Land Title Co Inc | |
| Patton Medina Susanne E | $251,000 | Whatcom Land Title Co Inc | |
| Litten Rita M | -- | None Available |
Source: Public Records
Mortgage History
| Date | Status | Borrower | Loan Amount |
|---|---|---|---|
| Open | Medina Victor | $367,500 | |
| Closed | Patton Medina Susanne E | $243,470 | |
| Closed | Patton Medina Susanne E | $9,738 |
Source: Public Records
Tax History Compared to Growth
Tax History
| Year | Tax Paid | Tax Assessment Tax Assessment Total Assessment is a certain percentage of the fair market value that is determined by local assessors to be the total taxable value of land and additions on the property. | Land | Improvement |
|---|---|---|---|---|
| 2024 | $3,610 | $444,128 | $225,942 | $218,186 |
| 2023 | $3,610 | $463,657 | $235,877 | $227,780 |
| 2022 | $3,122 | $406,717 | $206,910 | $199,807 |
| 2021 | $2,183 | $336,130 | $171,000 | $165,130 |
| 2020 | $2,132 | $221,851 | $101,251 | $120,600 |
| 2019 | $1,913 | $207,307 | $94,673 | $112,634 |
| 2018 | $1,979 | $185,943 | $84,923 | $101,020 |
| 2017 | $1,724 | $164,524 | $75,140 | $89,384 |
| 2016 | $1,698 | $149,557 | $68,380 | $81,177 |
| 2015 | $1,725 | $142,422 | $65,000 | $77,422 |
| 2014 | -- | $140,764 | $53,664 | $87,100 |
| 2013 | -- | $134,932 | $52,000 | $82,932 |
Source: Public Records
Map
Nearby Homes
- 3001 E Sunset Dr
- 3010 E Sunset Dr
- 3709 Bristol St
- 3713 Bristol St
- 3527 Sussex Dr
- 3606 Tree Farm Ct
- 2809 E Sunset Dr
- 0 E Bakerview Rd Unit NWM2398341
- 1314 Welling Rd
- 3715 E Sunset Dr
- 3159 Chandler Pkwy
- 3155 Chandler Pkwy
- 3153 Chandler Pkwy
- 2870 E Bakerview Rd
- 1379 Northwood Ct
- 2413 E Sunset Dr
- 3852 Del Bonita Way
- 1368 Roma Rd
- 1430 Welling Rd
- 4160 Hannegan Rd
- 3635 E Mcleod Rd
- 1139 Mt Baker Hwy
- 3101 Sunset Way
- 3000 E Sunset Dr
- 1145 Mt Baker Hwy
- 1151 Mt Baker Hwy
- 3940 Trickle Creek Blvd
- 3326 Bristol Way
- 0 Bristol Way Unit 774177
- 3944 Trickle Creek Blvd
- 3322 Bristol Way
- 3935 Trickle Creek Blvd
- 3948 Trickle Creek Blvd
- 1155 Mt Baker Hwy
- 3939 Trickle Creek Blvd
- 3318 Bristol Way
- 3228 E Sunset Dr
- 3943 Trickle Creek Blvd
- 3952 Trickle Creek Blvd
- 3226 E Sunset Dr