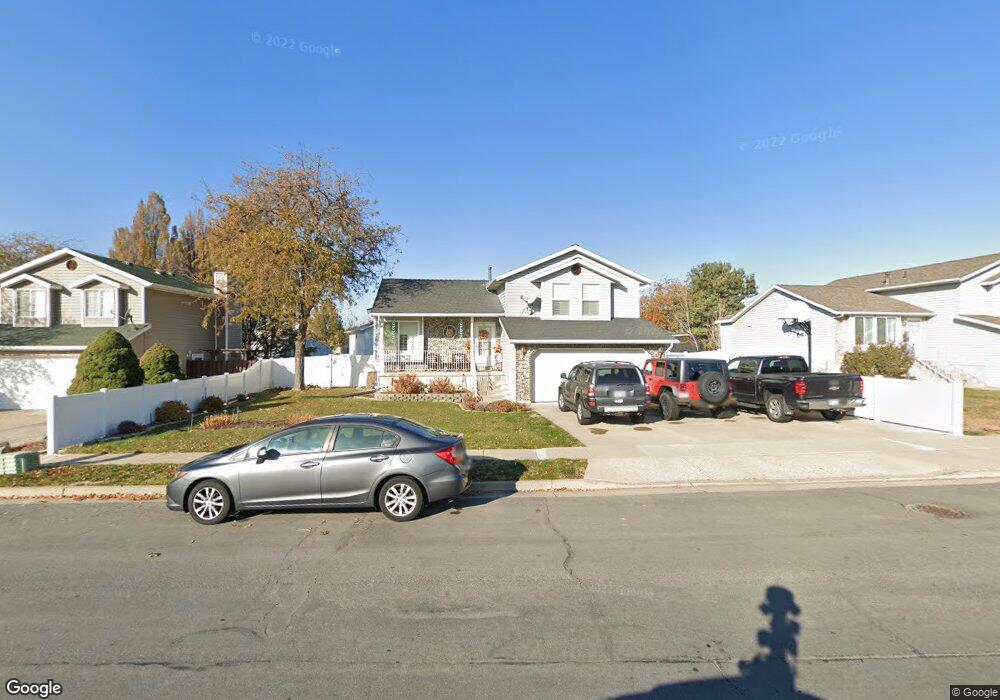
1131 N 75 W Layton, UT 84041
Estimated Value: $454,564 - $509,000
5
Beds
4
Baths
1,575
Sq Ft
$311/Sq Ft
Est. Value
About This Home
This home is located at 1131 N 75 W, Layton, UT 84041 and is currently estimated at $489,391, approximately $310 per square foot. 1131 N 75 W is a home located in Davis County with nearby schools including Crestview Elementary School, Central Davis Junior High School, and Northridge High School.
Ownership History
Date
Name
Owned For
Owner Type
Purchase Details
Closed on
May 19, 2008
Sold by
Mccutchan Marc A
Bought by
Mccutchan Marc A and Mccutchan Sayuri
Current Estimated Value
Home Financials for this Owner
Home Financials are based on the most recent Mortgage that was taken out on this home.
Original Mortgage
$126,000
Interest Rate
5.38%
Mortgage Type
New Conventional
Purchase Details
Closed on
Mar 12, 2007
Sold by
Mccutchan Marc A and Mccutchan Sayuri
Bought by
Mccutchan Marc A
Home Financials for this Owner
Home Financials are based on the most recent Mortgage that was taken out on this home.
Original Mortgage
$28,650
Interest Rate
6.29%
Mortgage Type
New Conventional
Create a Home Valuation Report for This Property
The Home Valuation Report is an in-depth analysis detailing your home's value as well as a comparison with similar homes in the area
Home Values in the Area
Average Home Value in this Area
Purchase History
| Date | Buyer | Sale Price | Title Company |
|---|---|---|---|
| Mccutchan Marc A | -- | Lsi Title Agency Inc | |
| Mccutchan Marc A | -- | Backman Title Services |
Source: Public Records
Mortgage History
| Date | Status | Borrower | Loan Amount |
|---|---|---|---|
| Closed | Mccutchan Marc A | $126,000 | |
| Closed | Mccutchan Marc A | $28,650 |
Source: Public Records
Tax History Compared to Growth
Tax History
| Year | Tax Paid | Tax Assessment Tax Assessment Total Assessment is a certain percentage of the fair market value that is determined by local assessors to be the total taxable value of land and additions on the property. | Land | Improvement |
|---|---|---|---|---|
| 2025 | $909 | $251,900 | $93,061 | $158,839 |
| 2024 | $854 | $242,001 | $108,950 | $133,051 |
| 2023 | $882 | $426,000 | $134,398 | $291,602 |
| 2022 | $1,490 | $235,950 | $69,594 | $166,356 |
| 2021 | $1,110 | $318,000 | $93,859 | $224,141 |
| 2020 | $889 | $277,000 | $80,543 | $196,457 |
| 2019 | $857 | $267,000 | $77,952 | $189,048 |
| 2018 | $695 | $241,000 | $77,952 | $163,048 |
| 2016 | $550 | $116,380 | $23,882 | $92,498 |
| 2015 | $1,502 | $104,720 | $23,882 | $80,838 |
| 2014 | $469 | $107,927 | $23,882 | $84,045 |
| 2013 | -- | $100,700 | $22,179 | $78,521 |
Source: Public Records
Map
Nearby Homes