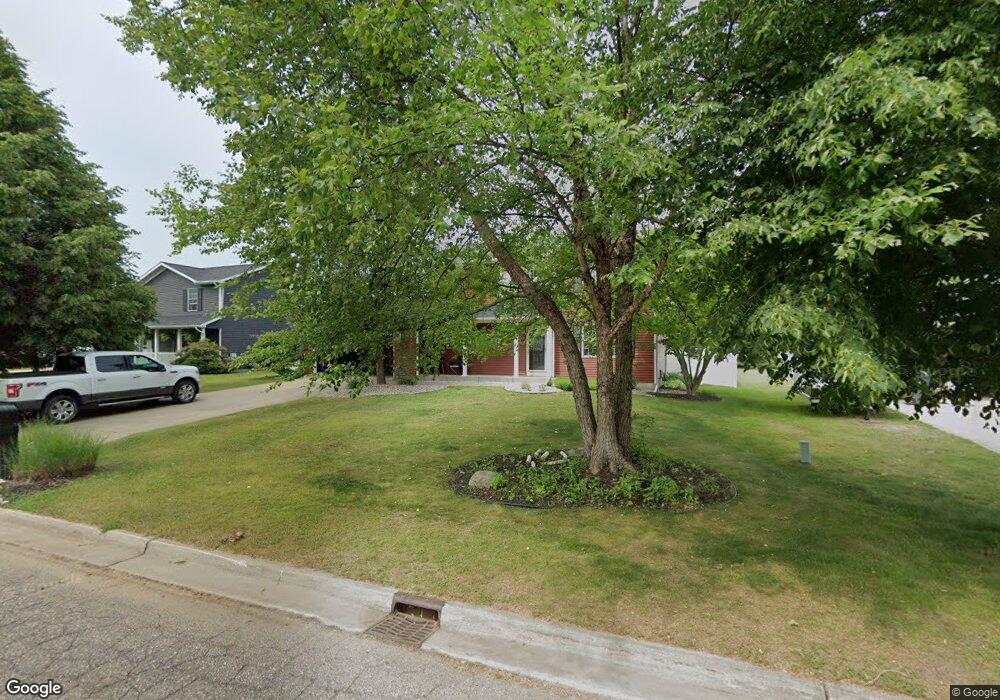
1131 N Peach Ct Plainwell, MI 49080
Estimated Value: $327,000 - $365,000
3
Beds
3
Baths
2,384
Sq Ft
$146/Sq Ft
Est. Value
About This Home
This home is located at 1131 N Peach Ct, Plainwell, MI 49080 and is currently estimated at $347,114, approximately $145 per square foot. 1131 N Peach Ct is a home located in Allegan County with nearby schools including Plainwell High School and Otsego Christian Academy.
Ownership History
Date
Name
Owned For
Owner Type
Purchase Details
Closed on
Mar 7, 2024
Sold by
Saeger Ryan and Saeger Rachel
Bought by
Saeger Ryan and Saeger Rachel
Current Estimated Value
Home Financials for this Owner
Home Financials are based on the most recent Mortgage that was taken out on this home.
Original Mortgage
$325,000
Outstanding Balance
$319,366
Interest Rate
7%
Mortgage Type
New Conventional
Estimated Equity
$27,748
Purchase Details
Closed on
Jan 31, 2005
Sold by
Jones Kenneth W and Jones Jennifer C
Bought by
Loubert Cary and Loubert Karie
Home Financials for this Owner
Home Financials are based on the most recent Mortgage that was taken out on this home.
Original Mortgage
$133,520
Interest Rate
5.83%
Mortgage Type
New Conventional
Purchase Details
Closed on
Jul 7, 1999
Sold by
"Thomas Termeer Builder
Bought by
Inc"
Create a Home Valuation Report for This Property
The Home Valuation Report is an in-depth analysis detailing your home's value as well as a comparison with similar homes in the area
Home Values in the Area
Average Home Value in this Area
Purchase History
| Date | Buyer | Sale Price | Title Company |
|---|---|---|---|
| Saeger Ryan | $325,000 | None Listed On Document | |
| Saeger Ryan | $325,000 | None Listed On Document | |
| Loubert Cary | $166,900 | Chicago Title | |
| Inc" | $138,000 | -- | |
| Inc" | $138,000 | -- |
Source: Public Records
Mortgage History
| Date | Status | Borrower | Loan Amount |
|---|---|---|---|
| Open | Saeger Ryan | $325,000 | |
| Closed | Saeger Ryan | $325,000 | |
| Previous Owner | Loubert Cary | $133,520 | |
| Previous Owner | Loubert Cary | $133,520 |
Source: Public Records
Tax History
| Year | Tax Paid | Tax Assessment Tax Assessment Total Assessment is a certain percentage of the fair market value that is determined by local assessors to be the total taxable value of land and additions on the property. | Land | Improvement |
|---|---|---|---|---|
| 2025 | $3,980 | $178,200 | $25,800 | $152,400 |
| 2024 | $3,607 | $163,100 | $23,400 | $139,700 |
| 2023 | $3,667 | $144,500 | $21,700 | $122,800 |
| 2022 | $3,607 | $136,600 | $21,400 | $115,200 |
| 2021 | $3,464 | $124,800 | $19,600 | $105,200 |
| 2020 | $3,419 | $112,700 | $15,900 | $96,800 |
| 2019 | $3,098 | $105,200 | $15,200 | $90,000 |
| 2018 | $0 | $89,800 | $13,100 | $76,700 |
| 2017 | $0 | $86,700 | $12,800 | $73,900 |
| 2016 | $0 | $79,000 | $9,000 | $70,000 |
| 2015 | -- | $79,000 | $9,000 | $70,000 |
| 2014 | -- | $69,300 | $9,000 | $60,300 |
| 2013 | -- | $65,300 | $9,000 | $56,300 |
Source: Public Records
Map
Nearby Homes
- 233 Washington Ave
- 1036 Sir Knight Rd
- 140 W 1st Ave
- 830 Miller Rd Unit 26.98 Acres
- 1038 Allen Ct
- 317 E Chart St
- 721 E Bridge St
- 770 Miller Rd
- 426 W Bridge St
- 716 10th St
- 551 W Bridge St
- 404 Park St
- 355 12th St
- 1170 W Bridge St
- VL 107th Ave
- 1248 Keith St
- 1056 Elmwood St
- V/L Bronson Ave
- 1046 Bronson Ave
- 1224 102nd Ave
- 1143 N Peach Ct
- 1124 N Apple Ct
- 1155 N Peach Ct
- 1107 N Peach Ct
- 1136 N Apple Ct
- 1116 N Apple Ct
- 1148 N Apple Ct
- 1108 N Apple Ct
- 1167 N Peach Ct
- 1130 N Peach Ct
- 1118 N Peach Ct
- 1160 N Apple Ct
- 1154 N Peach Ct
- 1106 N Peach Ct
- 1179 N Peach Ct
- 1087 S Peach Ct
- 1166 N Peach Ct
- 1131 N Apple Ct
- 1172 N Apple Ct
- 1088 S Apple Ct
Your Personal Tour Guide
Ask me questions while you tour the home.