Estimated Value: $326,000 - $412,000
2
Beds
3
Baths
2,294
Sq Ft
$155/Sq Ft
Est. Value
About This Home
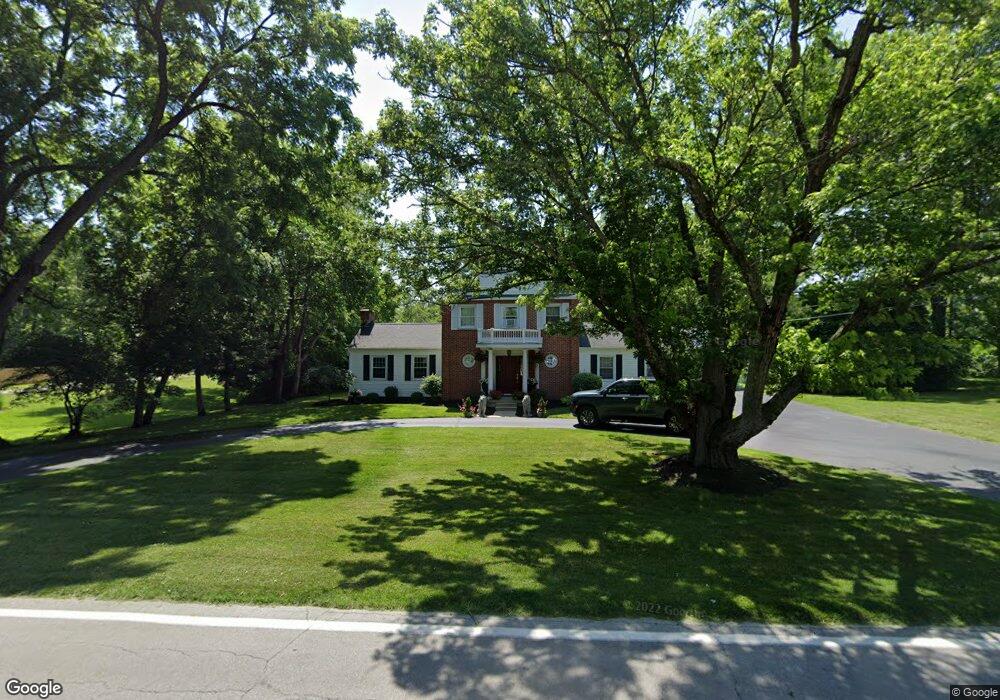
This home is located at 1131 Old Springfield Pike, Xenia, OH 45385 and is currently estimated at $356,398, approximately $155 per square foot. 1131 Old Springfield Pike is a home located in Greene County with nearby schools including Xenia High School and Legacy Christian Academy.
Ownership History
Date
Name
Owned For
Owner Type
Purchase Details
Closed on
Dec 14, 2007
Sold by
Johnson Douglas N and Johnson Leslie B
Bought by
Thompson Jonathan S and Thompson Mary Ellen
Current Estimated Value
Home Financials for this Owner
Home Financials are based on the most recent Mortgage that was taken out on this home.
Original Mortgage
$168,000
Outstanding Balance
$101,859
Interest Rate
5.5%
Mortgage Type
New Conventional
Estimated Equity
$254,539
Purchase Details
Closed on
Dec 5, 1994
Sold by
Memering Robert D
Bought by
Johnson Douglas N and Johnson K
Home Financials for this Owner
Home Financials are based on the most recent Mortgage that was taken out on this home.
Original Mortgage
$123,200
Interest Rate
7.87%
Mortgage Type
New Conventional
Create a Home Valuation Report for This Property
The Home Valuation Report is an in-depth analysis detailing your home's value as well as a comparison with similar homes in the area
Home Values in the Area
Average Home Value in this Area
Purchase History
| Date | Buyer | Sale Price | Title Company |
|---|---|---|---|
| Thompson Jonathan S | $210,000 | Attorney | |
| Johnson Douglas N | $136,900 | -- |
Source: Public Records
Mortgage History
| Date | Status | Borrower | Loan Amount |
|---|---|---|---|
| Open | Thompson Jonathan S | $168,000 | |
| Closed | Johnson Douglas N | $123,200 |
Source: Public Records
Tax History Compared to Growth
Tax History
| Year | Tax Paid | Tax Assessment Tax Assessment Total Assessment is a certain percentage of the fair market value that is determined by local assessors to be the total taxable value of land and additions on the property. | Land | Improvement |
|---|---|---|---|---|
| 2024 | $4,591 | $94,450 | $14,970 | $79,480 |
| 2023 | $4,591 | $94,450 | $14,970 | $79,480 |
| 2022 | $3,793 | $70,720 | $12,470 | $58,250 |
| 2021 | $3,841 | $70,720 | $12,470 | $58,250 |
| 2020 | $3,691 | $70,720 | $12,470 | $58,250 |
| 2019 | $3,133 | $56,360 | $13,100 | $43,260 |
| 2018 | $3,144 | $56,360 | $13,100 | $43,260 |
| 2017 | $3,060 | $56,360 | $13,100 | $43,260 |
| 2016 | $3,000 | $52,870 | $13,100 | $39,770 |
| 2015 | $3,008 | $52,870 | $13,100 | $39,770 |
| 2014 | $2,888 | $52,870 | $13,100 | $39,770 |
Source: Public Records
Map
Nearby Homes
- 15 Sexton Dr
- 2537 Ridge Rd
- 2018 Tahoe Dr
- 2094 Malibu Trail
- 1968 El Camino Dr
- 1872 Harris Ln
- 1815 Promenade Ln
- 493 Hollywood Blvd
- 499 Hollywood Blvd
- 965 Oak Dale Dr
- 1820 Palmer Ct
- 1814 Palmer Ct
- 1791 Palmer Ct
- 1808 Palmer Ct
- 1802 Palmer Ct
- 1796 Palmer Ct
- 517 Hollywood Blvd
- 523 Hollywood Blvd
- 532 Hollywood Blvd
- Harmony Plan at Grandstone Trace
- 1119 Old Springfield Pike
- 1134 Old Springfield Pike
- 1109 Old Springfield Pike
- 1140 Old Springfield Pike
- 1166 Old Springfield Pike
- 1124 Old Springfield Pike
- 75 Sexton Dr
- 1099 Old Springfield Pike
- 14 Sexton Dr
- 1175 Old Springfield Pike
- 12 Sexton Dr
- 67 Sexton Dr
- 1089 Old Springfield Pike
- 6 Sexton Dr
- 66 Sexton Dr
- 8 Sexton Dr
- 20 Sexton Dr
- 63 Sexton Dr
- 26 Sexton Dr
- 62 Sexton Dr