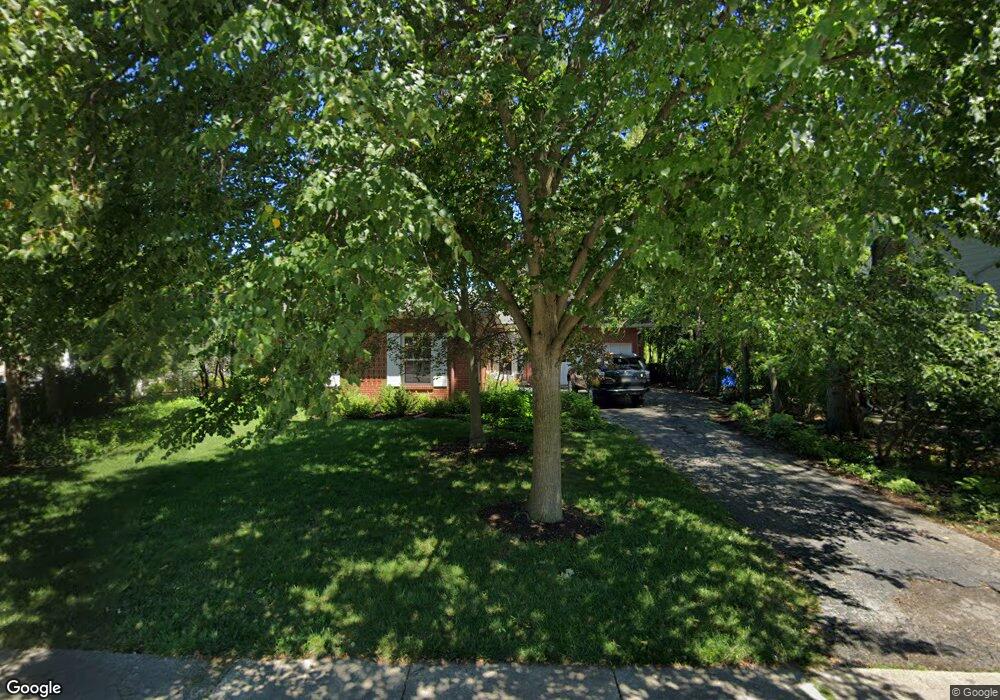
1131 Raleigh Rd Glenview, IL 60025
Estimated Value: $699,000 - $750,139
3
Beds
2
Baths
1,722
Sq Ft
$422/Sq Ft
Est. Value
About This Home
This home is located at 1131 Raleigh Rd, Glenview, IL 60025 and is currently estimated at $726,285, approximately $421 per square foot. 1131 Raleigh Rd is a home located in Cook County with nearby schools including Lyon Elementary School, Pleasant Ridge Elementary School, and Springman Middle School.
Ownership History
Date
Name
Owned For
Owner Type
Purchase Details
Closed on
May 15, 2004
Sold by
Mead Caroline
Bought by
Faut Brian and Faut Patricia
Current Estimated Value
Home Financials for this Owner
Home Financials are based on the most recent Mortgage that was taken out on this home.
Original Mortgage
$437,600
Interest Rate
6.42%
Mortgage Type
New Conventional
Purchase Details
Closed on
Feb 14, 2001
Sold by
Jones Norman H and Jones Irene M
Bought by
Mead William and Mead Caroline
Home Financials for this Owner
Home Financials are based on the most recent Mortgage that was taken out on this home.
Original Mortgage
$395,250
Interest Rate
7.03%
Create a Home Valuation Report for This Property
The Home Valuation Report is an in-depth analysis detailing your home's value as well as a comparison with similar homes in the area
Home Values in the Area
Average Home Value in this Area
Purchase History
| Date | Buyer | Sale Price | Title Company |
|---|---|---|---|
| Faut Brian | $547,000 | Cti | |
| Mead William | $417,500 | Commonwealth Land Title Ins |
Source: Public Records
Mortgage History
| Date | Status | Borrower | Loan Amount |
|---|---|---|---|
| Previous Owner | Faut Brian | $437,600 | |
| Previous Owner | Mead William | $395,250 |
Source: Public Records
Tax History Compared to Growth
Tax History
| Year | Tax Paid | Tax Assessment Tax Assessment Total Assessment is a certain percentage of the fair market value that is determined by local assessors to be the total taxable value of land and additions on the property. | Land | Improvement |
|---|---|---|---|---|
| 2024 | $9,732 | $47,284 | $18,492 | $28,792 |
| 2023 | $10,461 | $47,284 | $18,492 | $28,792 |
| 2022 | $10,461 | $52,054 | $18,492 | $33,562 |
| 2021 | $9,467 | $41,368 | $11,095 | $30,273 |
| 2020 | $9,411 | $41,368 | $11,095 | $30,273 |
| 2019 | $9,396 | $48,475 | $11,095 | $37,380 |
| 2018 | $8,908 | $42,168 | $9,708 | $32,460 |
| 2017 | $8,684 | $42,168 | $9,708 | $32,460 |
| 2016 | $10,557 | $52,404 | $9,708 | $42,696 |
| 2015 | $8,617 | $38,810 | $7,859 | $30,951 |
| 2014 | $8,472 | $38,810 | $7,859 | $30,951 |
| 2013 | $8,200 | $38,810 | $7,859 | $30,951 |
Source: Public Records
Map
Nearby Homes
- 1752 Maclean Ct
- 1800 Dewes St Unit 305
- 1800 Dewes St Unit 201
- 713 Carriage Hill Dr
- 1220 Depot St Unit 305
- 1220 Depot St Unit 109
- 1220 Depot St Unit 409
- 711 Carriage Hill Dr
- 1429 Pebblecreek Dr Unit 171
- 1342 Pine St
- 1508 Pebblecreek Dr Unit 14
- 609 Carriage Hill Dr
- 601 Carriage Hill Dr
- 1341 Greenwillow Ln Unit C
- 809 Lenox Rd
- 1553 Hawthorne Ln
- 1123 Longvalley Rd
- 1125 Raleigh Rd
- 1135 Raleigh Rd
- 1119 Raleigh Rd
- 1130 Raleigh Rd
- 1145 Raleigh Rd
- 1134 Raleigh Rd
- 1124 Raleigh Rd
- 1115 Raleigh Rd
- 1120 Raleigh Rd
- 1151 Raleigh Rd
- 1146 Raleigh Rd
- 1109 Raleigh Rd
- 1114 Raleigh Rd
- 1155 Raleigh Rd
- 1131 Vernon Dr
- 1152 Raleigh Rd
- 1125 Vernon Dr
- 1135 Vernon Dr
- 1103 Raleigh Rd
- 1100 Raleigh Rd