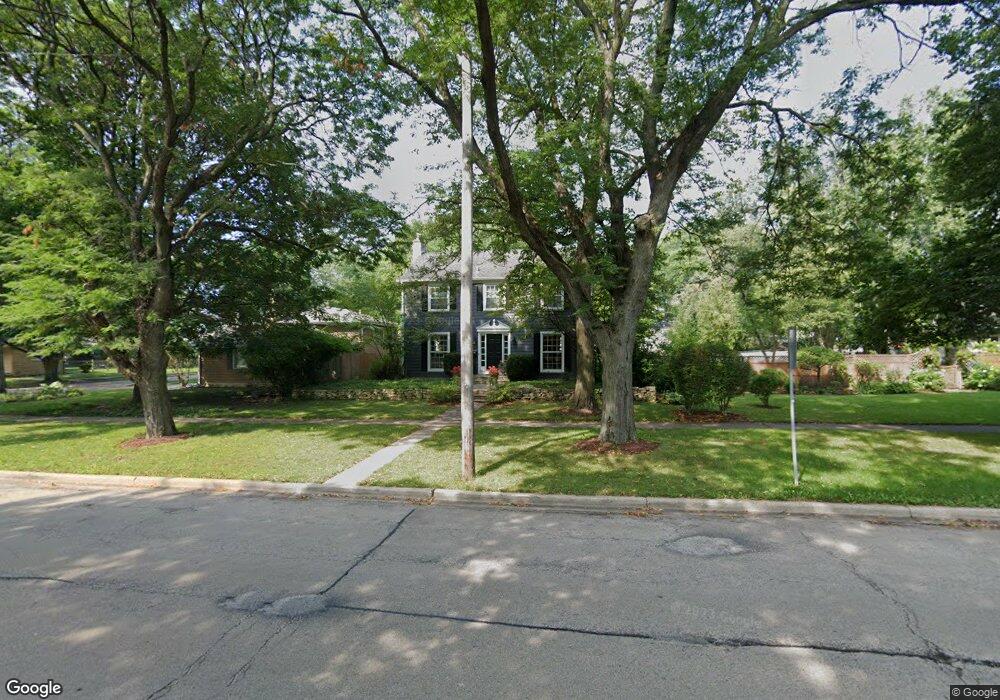
1131 S 3rd St Saint Charles, IL 60174
Southwest Saint Charles NeighborhoodEstimated Value: $457,857 - $533,000
3
Beds
3
Baths
1,850
Sq Ft
$266/Sq Ft
Est. Value
About This Home
This home is located at 1131 S 3rd St, Saint Charles, IL 60174 and is currently estimated at $492,214, approximately $266 per square foot. 1131 S 3rd St is a home located in Kane County with nearby schools including Davis Primary School, Richmond Intermediate School, and Thompson Middle School.
Ownership History
Date
Name
Owned For
Owner Type
Purchase Details
Closed on
Nov 24, 2010
Sold by
Stevens Timothy M and Rove Stevens Doris P
Bought by
Stevens Timothy M and Stevens Doris P
Current Estimated Value
Home Financials for this Owner
Home Financials are based on the most recent Mortgage that was taken out on this home.
Original Mortgage
$298,061
Outstanding Balance
$196,255
Interest Rate
4.23%
Mortgage Type
FHA
Estimated Equity
$295,959
Purchase Details
Closed on
Oct 30, 1998
Sold by
Smith Leland D and Smith Rita S
Bought by
Stevens Timothy M and Rove Stevens Doris P
Home Financials for this Owner
Home Financials are based on the most recent Mortgage that was taken out on this home.
Original Mortgage
$191,610
Interest Rate
8.75%
Create a Home Valuation Report for This Property
The Home Valuation Report is an in-depth analysis detailing your home's value as well as a comparison with similar homes in the area
Home Values in the Area
Average Home Value in this Area
Purchase History
| Date | Buyer | Sale Price | Title Company |
|---|---|---|---|
| Stevens Timothy M | -- | None Available | |
| Stevens Timothy M | $213,000 | Ticor Title Insurance |
Source: Public Records
Mortgage History
| Date | Status | Borrower | Loan Amount |
|---|---|---|---|
| Open | Stevens Timothy M | $298,061 | |
| Closed | Stevens Timothy M | $191,610 |
Source: Public Records
Tax History
| Year | Tax Paid | Tax Assessment Tax Assessment Total Assessment is a certain percentage of the fair market value that is determined by local assessors to be the total taxable value of land and additions on the property. | Land | Improvement |
|---|---|---|---|---|
| 2024 | $8,912 | $128,058 | $32,398 | $95,660 |
| 2023 | $8,533 | $114,614 | $28,997 | $85,617 |
| 2022 | $8,432 | $110,431 | $28,406 | $82,025 |
| 2021 | $8,096 | $105,263 | $27,077 | $78,186 |
| 2020 | $8,008 | $103,300 | $26,572 | $76,728 |
| 2019 | $7,862 | $101,255 | $26,046 | $75,209 |
| 2018 | $7,469 | $96,043 | $23,429 | $72,614 |
| 2017 | $7,270 | $92,759 | $22,628 | $70,131 |
| 2016 | $7,628 | $89,501 | $21,833 | $67,668 |
| 2015 | -- | $84,130 | $21,598 | $62,532 |
| 2014 | -- | $79,337 | $21,598 | $57,739 |
| 2013 | -- | $80,445 | $21,814 | $58,631 |
Source: Public Records
Map
Nearby Homes
- 1028 S 5th St
- 1219 Elm St
- 1334 S 5th St
- 505 Mosedale St
- 933 Elm St
- 1008 Pine St
- 885 Geneva Rd
- 46 White Oak Cir Unit 2
- 1001 Geneva Rd
- Lot 2 Geneva Rd
- Lot 1 Geneva Rd
- 640 Anderson Blvd
- 31 Roosevelt St
- 629 N Lincoln Ave
- 15 White Oak Cir
- 632 Illinois St
- 1186 Willowgate Ln
- 518 Illinois St
- 718 North St
- 409 Jackson Ave
Your Personal Tour Guide
Ask me questions while you tour the home.