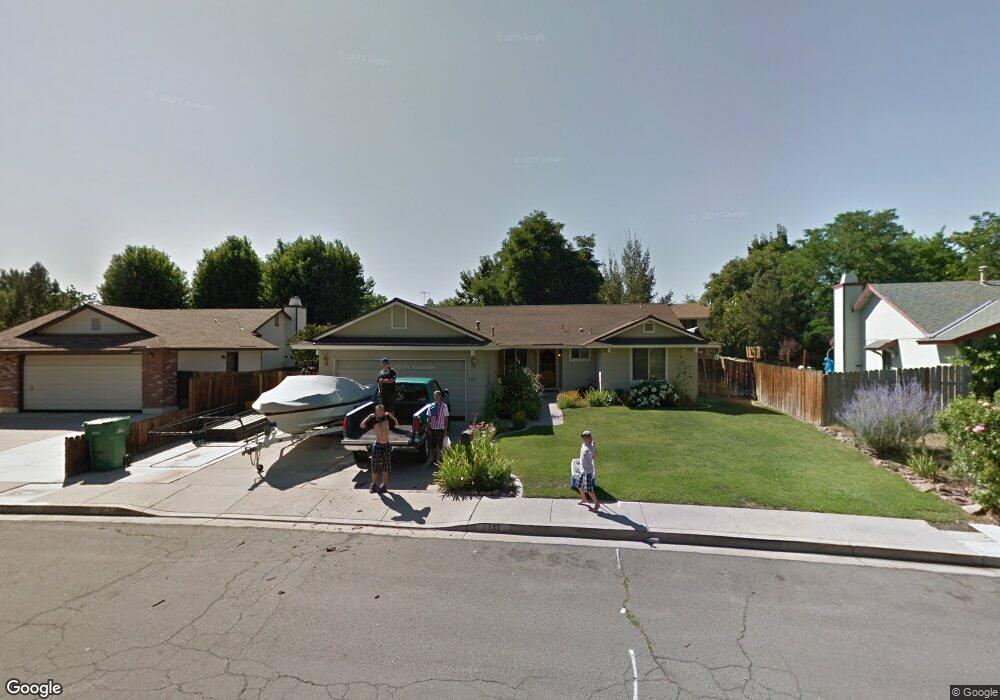
1131 Union St Sparks, NV 89434
O'Callaghan NeighborhoodEstimated Value: $463,173 - $488,000
3
Beds
2
Baths
1,642
Sq Ft
$289/Sq Ft
Est. Value
About This Home
This home is located at 1131 Union St, Sparks, NV 89434 and is currently estimated at $475,043, approximately $289 per square foot. 1131 Union St is a home located in Washoe County with nearby schools including Katherine Dunn Elementary School, George L Dilworth Middle School, and Edward C Reed High School.
Ownership History
Date
Name
Owned For
Owner Type
Purchase Details
Closed on
Mar 9, 2012
Sold by
Jackson Cavan D and Jackson Paulla M
Bought by
Jackson Paulla M
Current Estimated Value
Home Financials for this Owner
Home Financials are based on the most recent Mortgage that was taken out on this home.
Original Mortgage
$138,300
Outstanding Balance
$93,785
Interest Rate
3.83%
Mortgage Type
New Conventional
Estimated Equity
$381,258
Purchase Details
Closed on
Jul 22, 1997
Sold by
Jackson W David and Jackson Charlotte A
Bought by
Jackson Cavan D and Jackson Paulla M
Home Financials for this Owner
Home Financials are based on the most recent Mortgage that was taken out on this home.
Original Mortgage
$123,569
Interest Rate
7.83%
Mortgage Type
FHA
Purchase Details
Closed on
Feb 24, 1997
Sold by
Cutler Jack and Cutler Paulette Faye
Bought by
Jackson David and Jackson Charlotte A
Home Financials for this Owner
Home Financials are based on the most recent Mortgage that was taken out on this home.
Original Mortgage
$125,000
Interest Rate
7.63%
Create a Home Valuation Report for This Property
The Home Valuation Report is an in-depth analysis detailing your home's value as well as a comparison with similar homes in the area
Home Values in the Area
Average Home Value in this Area
Purchase History
| Date | Buyer | Sale Price | Title Company |
|---|---|---|---|
| Jackson Paulla M | -- | First American Title Co Llc | |
| Jackson Cavan D | $62,500 | Western Title Company Inc | |
| Jackson David | $125,000 | Founders Title Co |
Source: Public Records
Mortgage History
| Date | Status | Borrower | Loan Amount |
|---|---|---|---|
| Open | Jackson Paulla M | $138,300 | |
| Closed | Jackson Cavan D | $123,569 | |
| Closed | Jackson David | $125,000 |
Source: Public Records
Tax History
| Year | Tax Paid | Tax Assessment Tax Assessment Total Assessment is a certain percentage of the fair market value that is determined by local assessors to be the total taxable value of land and additions on the property. | Land | Improvement |
|---|---|---|---|---|
| 2026 | $1,269 | $67,248 | $34,650 | $32,598 |
| 2025 | $1,651 | $68,470 | $34,580 | $33,890 |
| 2024 | $1,604 | $67,589 | $32,725 | $34,864 |
| 2023 | $1,604 | $65,937 | $32,305 | $33,632 |
| 2022 | $1,558 | $54,506 | $26,005 | $28,501 |
| 2021 | $1,513 | $48,726 | $19,845 | $28,881 |
| 2020 | $1,467 | $49,184 | $19,775 | $29,409 |
| 2019 | $1,424 | $47,865 | $18,935 | $28,930 |
| 2018 | $1,383 | $42,687 | $13,965 | $28,722 |
| 2017 | $1,337 | $41,241 | $12,670 | $28,571 |
| 2016 | $1,305 | $40,934 | $11,410 | $29,524 |
| 2015 | $1,305 | $39,646 | $9,625 | $30,021 |
| 2014 | $1,261 | $37,261 | $8,225 | $29,036 |
| 2013 | -- | $33,529 | $6,090 | $27,439 |
Source: Public Records
Map
Nearby Homes
- 1332 Coachman Ct
- 1218 Junction Dr
- 1262 Union St
- 1438 Mandarin Ct
- 1658 Bluehaven Dr
- 1544 Woodhaven Ln
- 1280 O'Callaghan Dr
- 1012 Alta Vista Dr
- 968 Railborne Dr
- 675 Parlanti Ln Unit 52
- 675 Parlanti Ln Unit 124
- 675 Parlanti Ln Unit 38
- 675 Parlanti Ln Unit 11
- 675 Parlanti Ln Unit 42
- 675 Parlanti Ln
- 675 Parlanti Ln Unit 9
- 675 Parlanti Ln Unit 88
- 675 Parlanti Ln Unit 63
- 1695 Atlantic Way
- 931 Lionel Ct
- 1065 Union St
- 1137 Union St
- 1307 Coachman Dr Unit 2
- 1311 Coachman Dr
- 1305 Coachman Dr
- 1143 Union St
- 1321 Coachman Dr
- 1045 Union St
- 1149 Union St
- 1292 Junction Dr
- 1331 Coachman Dr
- 1023 Union St
- 1023 Union St Unit Street
- 1303 Coachman Dr
- 1308 Pullman Dr
- 1288 Junction Dr
- 1410 Coupler Way Unit 116
- 1410 Coupler Way Unit 116
- 1410 Coupler Way Unit 116
- 1410 Coupler Way Unit 116