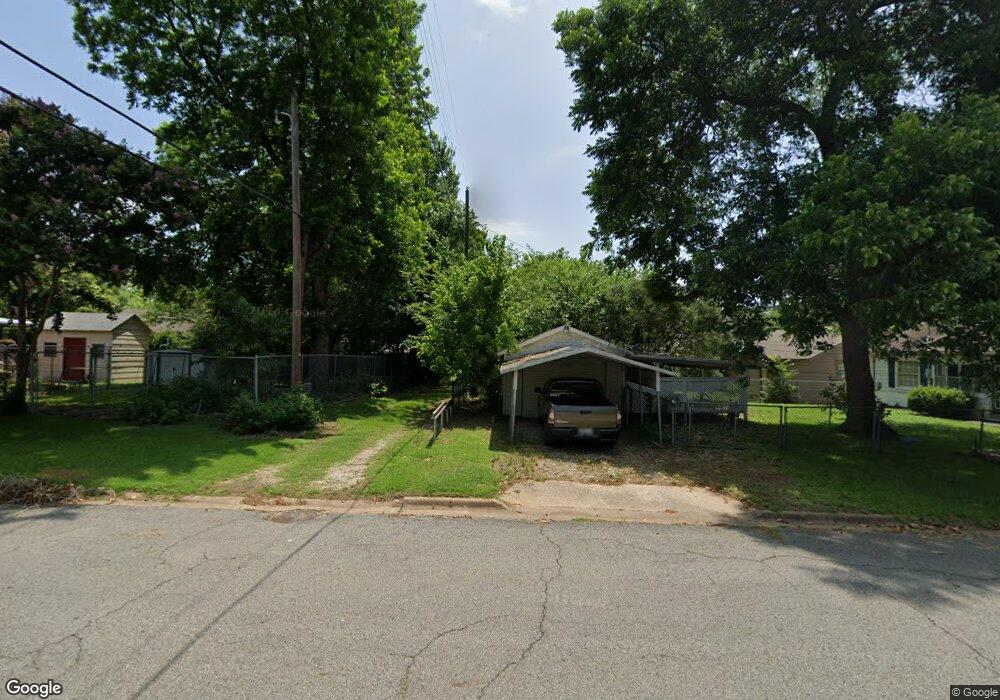
1131 W Chestnut St Denison, TX 75020
Estimated Value: $178,411 - $219,000
3
Beds
1
Bath
1,220
Sq Ft
$163/Sq Ft
Est. Value
About This Home
This home is located at 1131 W Chestnut St, Denison, TX 75020 and is currently estimated at $198,706, approximately $162 per square foot. 1131 W Chestnut St is a home located in Grayson County with nearby schools including Houston Elementary School, Scott Middle School, and Denison High School.
Ownership History
Date
Name
Owned For
Owner Type
Purchase Details
Closed on
Jun 11, 2022
Sold by
Robison David A
Bought by
Skinner Aaron William and Strouse Breanna Danielle
Current Estimated Value
Home Financials for this Owner
Home Financials are based on the most recent Mortgage that was taken out on this home.
Original Mortgage
$104,000
Outstanding Balance
$98,982
Interest Rate
5.3%
Mortgage Type
New Conventional
Estimated Equity
$99,724
Purchase Details
Closed on
Jul 10, 2015
Sold by
Pate Mary Grace and Hull Geneva K
Bought by
Robinson David A and Robinson Lauren E
Home Financials for this Owner
Home Financials are based on the most recent Mortgage that was taken out on this home.
Original Mortgage
$80,275
Interest Rate
3.9%
Mortgage Type
New Conventional
Create a Home Valuation Report for This Property
The Home Valuation Report is an in-depth analysis detailing your home's value as well as a comparison with similar homes in the area
Home Values in the Area
Average Home Value in this Area
Purchase History
| Date | Buyer | Sale Price | Title Company |
|---|---|---|---|
| Skinner Aaron William | -- | Chapin Title | |
| Robinson David A | -- | Chapin Title Co Inc |
Source: Public Records
Mortgage History
| Date | Status | Borrower | Loan Amount |
|---|---|---|---|
| Open | Skinner Aaron William | $104,000 | |
| Previous Owner | Robinson David A | $80,275 |
Source: Public Records
Tax History Compared to Growth
Tax History
| Year | Tax Paid | Tax Assessment Tax Assessment Total Assessment is a certain percentage of the fair market value that is determined by local assessors to be the total taxable value of land and additions on the property. | Land | Improvement |
|---|---|---|---|---|
| 2025 | $3,752 | $158,434 | $40,200 | $118,234 |
| 2024 | $3,752 | $161,501 | $40,200 | $121,301 |
| 2023 | $3,861 | $170,426 | $36,840 | $133,586 |
| 2022 | $3,742 | $157,497 | $36,840 | $120,657 |
| 2021 | $2,873 | $113,927 | $19,800 | $94,127 |
| 2020 | $2,893 | $109,660 | $12,000 | $97,660 |
| 2019 | $2,980 | $108,297 | $11,160 | $97,137 |
| 2018 | $2,519 | $90,793 | $6,300 | $84,493 |
| 2017 | $2,190 | $78,290 | $5,580 | $72,710 |
| 2016 | $1,863 | $66,606 | $3,480 | $63,126 |
| 2015 | $881 | $46,051 | $4,980 | $41,071 |
| 2014 | $1,023 | $45,748 | $4,980 | $40,768 |
Source: Public Records
Map
Nearby Homes
- 1109 W Crawford St
- 1221 W Crawford St
- 1231 W Main St
- 108 N Eddy Ave
- 1027 W Crawford St
- 1230 W Woodard St
- 1223 W Owing St
- 1120 W Owing St
- 1200 W Gandy St
- 1326 W Crawford St
- 1127 W Morgan St
- 1031 W Gandy St
- 1319 W Morgan St
- 1208 W Sears St
- 1315 W Gandy St
- 501 S Eddy Ave
- TBD W Main St
- 1217 W Nelson St
- 1111 W Sears St
- 1123 W Sears St
- 1121 W Chestnut St
- 1201 W Chestnut St
- 1130 W Main St
- 1124 W Main St
- 1119 W Chestnut St
- 1205 W Chestnut St
- 1120 W Main St
- 1200 W Main St
- 1130 W Chestnut St
- 1115 W Chestnut St
- 1116 W Main St
- 1126 W Chestnut St
- 1208 W Main St
- 1122 W Chestnut St
- 1200 W Chestnut St
- 1112 W Main St
- 1109 W Chestnut St
- 1120 W Chestnut St
- 1212 W Main St
- 1206 W Chestnut St