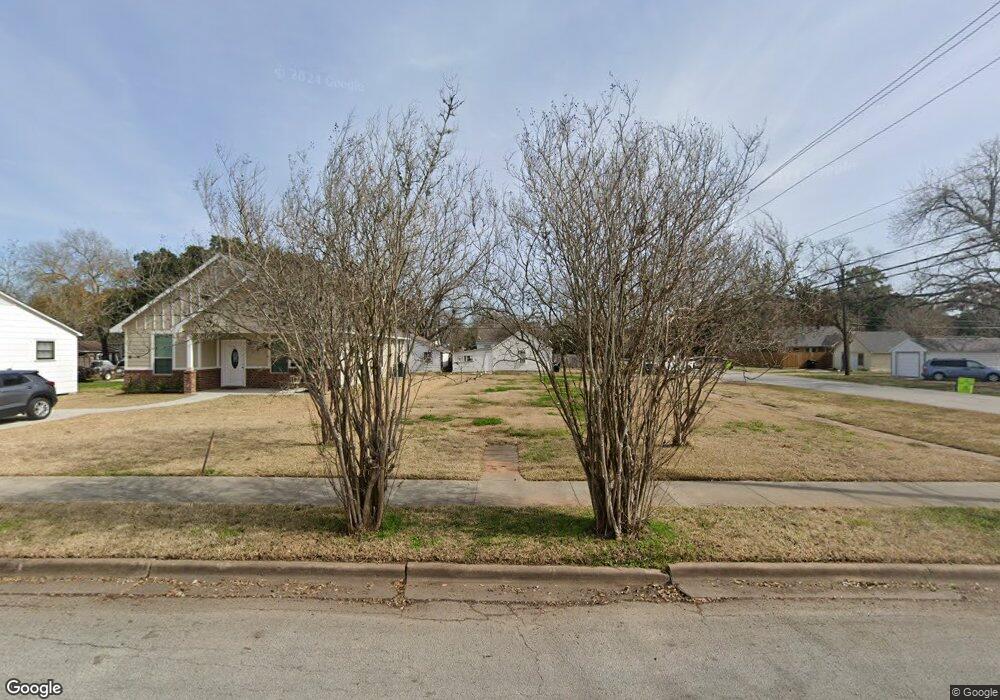
1131 Ward St Rosenberg, TX 77471
Estimated Value: $163,000 - $258,000
3
Beds
2
Baths
1,632
Sq Ft
$127/Sq Ft
Est. Value
About This Home
This home is located at 1131 Ward St, Rosenberg, TX 77471 and is currently estimated at $206,786, approximately $126 per square foot. 1131 Ward St is a home located in Fort Bend County with nearby schools including Travis Elementary School, Navarro Middle School, and George Junior High School.
Ownership History
Date
Name
Owned For
Owner Type
Purchase Details
Closed on
Feb 2, 2023
Sold by
Hutchison Curtis R
Bought by
Ramos Antonio and Davalos Selerina
Current Estimated Value
Purchase Details
Closed on
Aug 29, 2022
Sold by
Mahlmann Herne Rita
Bought by
Hutchison Curtis R
Purchase Details
Closed on
Jul 25, 2016
Sold by
Herne Rita Mahlmann and Donald E Mahlman Revocable Tru
Bought by
Mahlmann Herne Rita
Purchase Details
Closed on
Nov 25, 2015
Sold by
Morton Karen Rose and Turicchi Karen Rose
Bought by
Herne Rita Mahlmann
Create a Home Valuation Report for This Property
The Home Valuation Report is an in-depth analysis detailing your home's value as well as a comparison with similar homes in the area
Home Values in the Area
Average Home Value in this Area
Purchase History
| Date | Buyer | Sale Price | Title Company |
|---|---|---|---|
| Ramos Antonio | -- | Select Title | |
| Hutchison Curtis R | -- | Select Title Ins Agcy | |
| Mahlmann Herne Rita | -- | None Available | |
| Herne Rita Mahlmann | -- | -- | |
| Herne Rita Mahlmann | -- | Attorney |
Source: Public Records
Tax History Compared to Growth
Tax History
| Year | Tax Paid | Tax Assessment Tax Assessment Total Assessment is a certain percentage of the fair market value that is determined by local assessors to be the total taxable value of land and additions on the property. | Land | Improvement |
|---|---|---|---|---|
| 2025 | $2,219 | $480,878 | $117,474 | $363,404 |
| 2024 | $2,219 | $117,474 | -- | -- |
| 2023 | $1,779 | $92,129 | $0 | $0 |
| 2022 | $3,688 | $180,040 | $92,130 | $87,910 |
| 2021 | $3,413 | $164,510 | $82,500 | $82,010 |
| 2020 | $3,681 | $173,420 | $81,500 | $91,920 |
| 2019 | $2,435 | $106,630 | $47,600 | $59,030 |
| 2018 | $2,431 | $104,740 | $47,600 | $57,140 |
| 2017 | $2,395 | $102,620 | $47,600 | $55,020 |
| 2016 | $2,223 | $95,240 | $47,600 | $47,640 |
| 2015 | $1,123 | $47,850 | $23,800 | $24,050 |
| 2014 | $1,147 | $48,280 | $23,800 | $24,480 |
Source: Public Records
Map
Nearby Homes