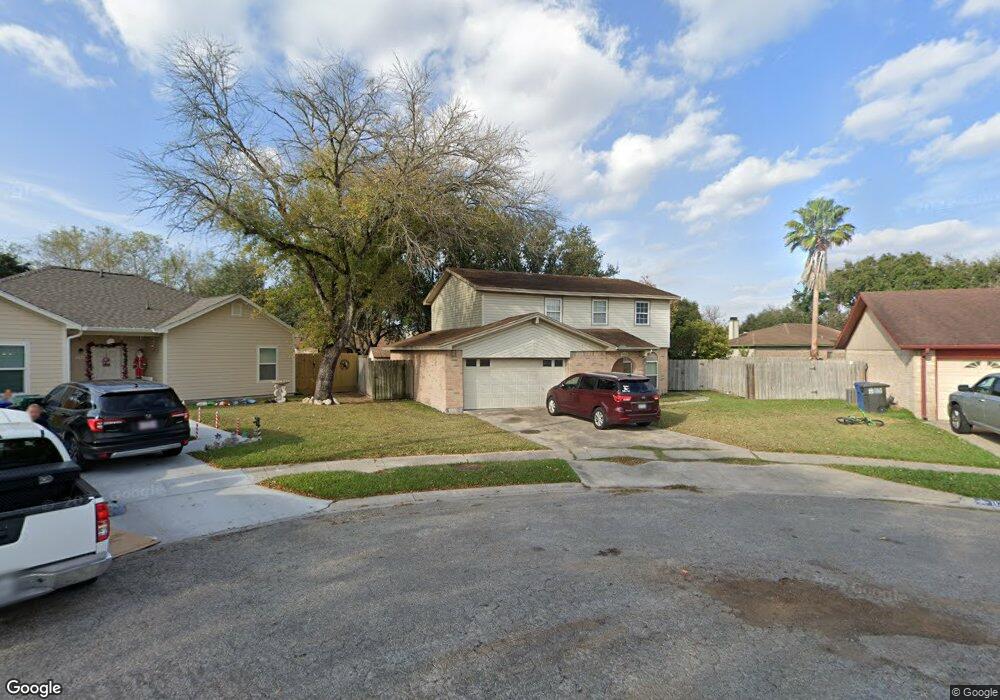
11314 Doris Creek Cir Unit IV Corpus Christi, TX 78410
Calallen NeighborhoodEstimated Value: $230,245 - $254,000
4
Beds
3
Baths
1,845
Sq Ft
$134/Sq Ft
Est. Value
About This Home
This home is located at 11314 Doris Creek Cir Unit IV, Corpus Christi, TX 78410 and is currently estimated at $246,311, approximately $133 per square foot. 11314 Doris Creek Cir Unit IV is a home located in Nueces County with nearby schools including Calallen West Intermediate School, Calallen Middle School, and Calallen High School.
Ownership History
Date
Name
Owned For
Owner Type
Purchase Details
Closed on
Jul 19, 2011
Sold by
Federal Home Loan Mortgage Corporation
Bought by
Martinez Alonzo and Martinez Nelda
Current Estimated Value
Home Financials for this Owner
Home Financials are based on the most recent Mortgage that was taken out on this home.
Original Mortgage
$81,700
Outstanding Balance
$6,131
Interest Rate
4.52%
Mortgage Type
Purchase Money Mortgage
Estimated Equity
$240,180
Purchase Details
Closed on
Apr 5, 2011
Sold by
Farmer Michael E and Farmer Luann
Bought by
Federal Home Loan Mortgage Corporation
Purchase Details
Closed on
Jul 13, 2006
Sold by
Gunter Dana L and Gunter Nancy
Bought by
Farmer Michael E and Farmer Luann
Home Financials for this Owner
Home Financials are based on the most recent Mortgage that was taken out on this home.
Original Mortgage
$116,000
Interest Rate
6.67%
Mortgage Type
Purchase Money Mortgage
Create a Home Valuation Report for This Property
The Home Valuation Report is an in-depth analysis detailing your home's value as well as a comparison with similar homes in the area
Home Values in the Area
Average Home Value in this Area
Purchase History
| Date | Buyer | Sale Price | Title Company |
|---|---|---|---|
| Martinez Alonzo | -- | Chicago Title | |
| Federal Home Loan Mortgage Corporation | $71,133 | None Available | |
| Farmer Michael E | -- | Security Title |
Source: Public Records
Mortgage History
| Date | Status | Borrower | Loan Amount |
|---|---|---|---|
| Open | Martinez Alonzo | $81,700 | |
| Previous Owner | Farmer Michael E | $116,000 |
Source: Public Records
Tax History Compared to Growth
Tax History
| Year | Tax Paid | Tax Assessment Tax Assessment Total Assessment is a certain percentage of the fair market value that is determined by local assessors to be the total taxable value of land and additions on the property. | Land | Improvement |
|---|---|---|---|---|
| 2025 | $1,773 | $256,258 | $23,671 | $232,587 |
| 2024 | $5,753 | $244,104 | $0 | $0 |
| 2023 | $1,734 | $221,913 | $0 | $0 |
| 2022 | $5,170 | $201,739 | $0 | $0 |
| 2021 | $4,938 | $185,775 | $23,671 | $162,104 |
| 2020 | $4,605 | $166,726 | $23,671 | $143,055 |
| 2019 | $4,790 | $168,560 | $23,671 | $144,889 |
| 2018 | $4,603 | $166,163 | $23,671 | $142,492 |
| 2017 | $4,663 | $169,372 | $23,671 | $145,701 |
| 2016 | $4,239 | $153,462 | $23,671 | $129,791 |
| 2015 | $3,408 | $148,669 | $23,671 | $124,998 |
| 2014 | $3,408 | $139,848 | $23,671 | $116,177 |
Source: Public Records
Map
Nearby Homes
- 11309 Dew Creek Cir
- 11517 Willowood Creek Dr
- 3706 Piedra Creek Dr
- 11502 S Creek Dr
- 3814 Whitney Dr
- 3849 Silver Creek Dr
- 4009 Sandy Hollow Dr
- 10941 Shady Ln
- 9210 Perseverance St
- 9226 Perseverance St
- LT 3 Calm River St
- LT 4 Calm River St
- LT 2 Calm River St
- 12822 Madalynn Dr
- 0 Leopard St Unit 9776510
- 0 Leopard St Unit 453148
- 0 NW & Pinnacle Blvd Unit 442462
- 1825 Jaelyn Emery Way
- 3618 Starlite Ln
- 11230 Blades St
- 11318 Doris Creek Cir
- 11310 Doris Creek Cir
- 11313 Red Creek Cir
- 11409 Woodway Creek Dr
- 11 Doris Cir Unit 350B
- 11405 Woodway Creek Dr
- 11313 Doris Creek Cir
- 14933 Lake Mead Dr
- 3919 Jayden
- 301 Essex St
- 10902 Ih 37 @ Sessions
- 15025 Lake Mead Dr
- 3733 Perfection Lake Ave
- 3922 Shiva Dr
- 3601 Perfection Lake Ave
- 3933 Shiva Dr
- 3713 Perfection Lake Ave
- 12102 Leopard St
- 11309 Red Creek Cir
- 11413 Woodway Creek Dr