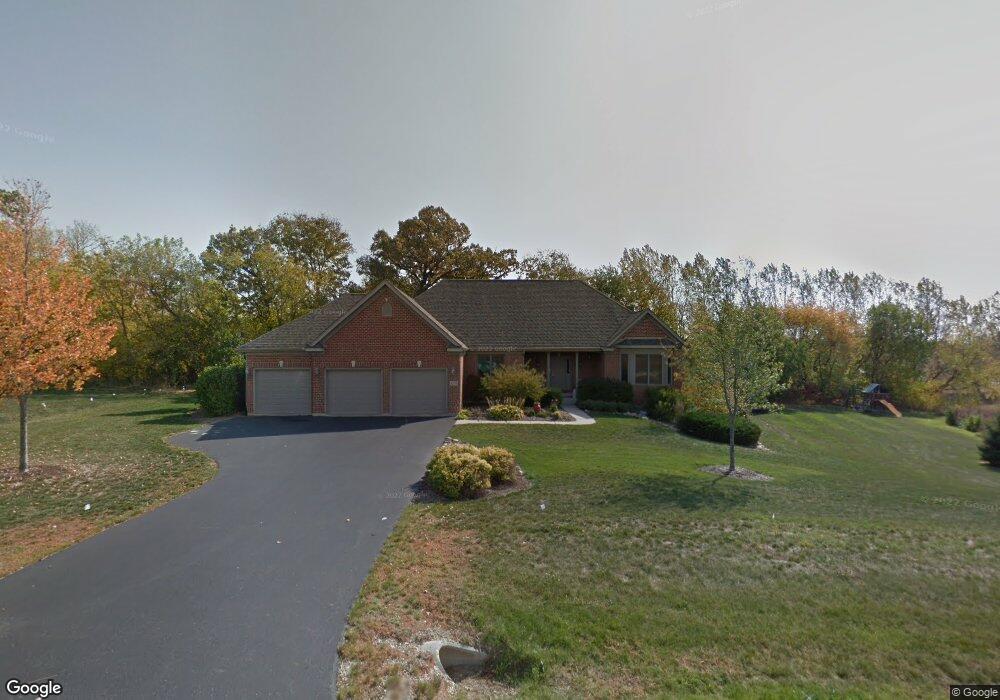
11316 Preservation Way Richmond, IL 60071
Estimated Value: $482,000 - $618,000
3
Beds
3
Baths
2,300
Sq Ft
$230/Sq Ft
Est. Value
About This Home
This home is located at 11316 Preservation Way, Richmond, IL 60071 and is currently estimated at $528,266, approximately $229 per square foot. 11316 Preservation Way is a home located in McHenry County with nearby schools including Richmond Grade School, Nippersink Middle School, and Richmond-Burton High School.
Ownership History
Date
Name
Owned For
Owner Type
Purchase Details
Closed on
Dec 2, 2010
Sold by
Cieszynski Scott E and Cieszynski Shelly M
Bought by
Tzavaras Konstantine S and Tzavaras Betsy L
Current Estimated Value
Home Financials for this Owner
Home Financials are based on the most recent Mortgage that was taken out on this home.
Original Mortgage
$256,000
Outstanding Balance
$169,220
Interest Rate
4.23%
Mortgage Type
New Conventional
Estimated Equity
$359,046
Purchase Details
Closed on
Oct 5, 2005
Sold by
J Pease Construction Co Inc Profit Shari
Bought by
Cieszynski Scott E and Cieszynski Shelly M
Home Financials for this Owner
Home Financials are based on the most recent Mortgage that was taken out on this home.
Original Mortgage
$332,512
Interest Rate
4.75%
Mortgage Type
Fannie Mae Freddie Mac
Create a Home Valuation Report for This Property
The Home Valuation Report is an in-depth analysis detailing your home's value as well as a comparison with similar homes in the area
Home Values in the Area
Average Home Value in this Area
Purchase History
| Date | Buyer | Sale Price | Title Company |
|---|---|---|---|
| Tzavaras Konstantine S | $320,000 | Chicago Title | |
| Cieszynski Scott E | $415,641 | Chicago Title |
Source: Public Records
Mortgage History
| Date | Status | Borrower | Loan Amount |
|---|---|---|---|
| Open | Tzavaras Konstantine S | $256,000 | |
| Previous Owner | Cieszynski Scott E | $332,512 |
Source: Public Records
Tax History
| Year | Tax Paid | Tax Assessment Tax Assessment Total Assessment is a certain percentage of the fair market value that is determined by local assessors to be the total taxable value of land and additions on the property. | Land | Improvement |
|---|---|---|---|---|
| 2024 | $10,037 | $147,658 | $16,612 | $131,046 |
| 2023 | $9,717 | $134,226 | $15,501 | $118,725 |
| 2022 | $9,147 | $118,074 | $13,636 | $104,438 |
| 2021 | $8,695 | $111,306 | $12,854 | $98,452 |
| 2020 | $8,503 | $106,401 | $12,288 | $94,113 |
| 2019 | $8,567 | $104,746 | $12,097 | $92,649 |
| 2018 | $8,755 | $101,508 | $11,723 | $89,785 |
| 2017 | $9,137 | $100,403 | $21,090 | $79,313 |
| 2016 | $9,184 | $95,886 | $20,141 | $75,745 |
| 2013 | -- | $81,677 | $21,471 | $60,206 |
Source: Public Records
Map
Nearby Homes
- 11101 Serenity Path
- 10905 Breezy Lawn Rd
- 11111 Huron Dr
- 11013 Serenity Path
- Lt1 Majestic Way W
- 36324 128th St
- 11106 Siedschlag Rd
- Lt17 Majestic Way E
- 2919 Il Route 173
- 2102 W Hunters Ln
- Lot 16 Harding
- 2611 E Lake Shore Dr
- Lot 17 & 18 Harding Ave
- 2003 Matthew Ave
- 35324 110th St
- 3159 E Lakeshore Dr
- 10105 N Clark Rd
- 9436 Bellaire Ln
- 210 W Spring Dr
- 509 Sunset Rd
- 11402 Preservation Way
- 11308 Preservation Way
- 1716 Vineyard Ln
- 11307 Preservation Way
- 11302 Preservation Way
- 11412 Preservation Way
- 1712 Vineyard Ln
- 1720 Vineyard Ln
- 11304 Heritage Path
- 11418 Preservation Way
- 11316 Heritage Path
- 11402 Heritage Path
- 1814 Vineyard Ln
- 11219 Serenity Path
- 1551 Augusta Way
- 11202 Preservation Way
- 1801 Vineyard Ln
- 11502 Preservation Way
- 1702 Vineyard Ln
- 1619 Vineyard Ln
Your Personal Tour Guide
Ask me questions while you tour the home.