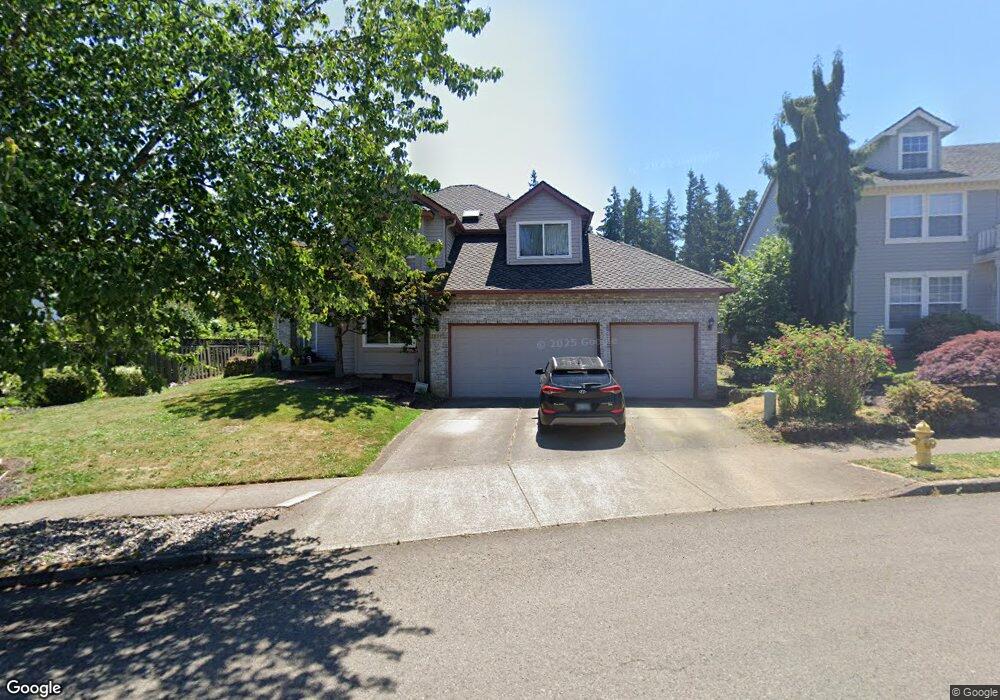
11317 SE Highland Loop Clackamas, OR 97015
Estimated Value: $723,000 - $811,000
3
Beds
3
Baths
3,041
Sq Ft
$254/Sq Ft
Est. Value
About This Home
This home is located at 11317 SE Highland Loop, Clackamas, OR 97015 and is currently estimated at $772,538, approximately $254 per square foot. 11317 SE Highland Loop is a home located in Clackamas County with nearby schools including Rock Creek Middle School, Clackamas High School, and Cascade Heights Public Charter School.
Ownership History
Date
Name
Owned For
Owner Type
Purchase Details
Closed on
Dec 20, 2004
Sold by
Peak Brenda J and Peak John B
Bought by
Mcelroy Juanita
Current Estimated Value
Home Financials for this Owner
Home Financials are based on the most recent Mortgage that was taken out on this home.
Original Mortgage
$327,200
Outstanding Balance
$186,227
Interest Rate
7.95%
Mortgage Type
Purchase Money Mortgage
Estimated Equity
$586,311
Purchase Details
Closed on
Apr 19, 2002
Sold by
Peak John B
Bought by
Peak John B and Peak Brenda J
Purchase Details
Closed on
Nov 30, 2001
Sold by
Peack Brenda J
Bought by
Peak John B
Home Financials for this Owner
Home Financials are based on the most recent Mortgage that was taken out on this home.
Original Mortgage
$275,625
Interest Rate
6.63%
Mortgage Type
Stand Alone First
Purchase Details
Closed on
Jun 20, 1996
Sold by
Sun Ridge Construction Inc
Bought by
Peak John B and Peak Brenda J
Home Financials for this Owner
Home Financials are based on the most recent Mortgage that was taken out on this home.
Original Mortgage
$179,950
Interest Rate
8.25%
Create a Home Valuation Report for This Property
The Home Valuation Report is an in-depth analysis detailing your home's value as well as a comparison with similar homes in the area
Home Values in the Area
Average Home Value in this Area
Purchase History
| Date | Buyer | Sale Price | Title Company |
|---|---|---|---|
| Mcelroy Juanita | $310,500 | Stewart Title | |
| Peak John B | -- | -- | |
| Peak John B | -- | Stewart Title | |
| Peak John B | $279,950 | First American Title Ins Co |
Source: Public Records
Mortgage History
| Date | Status | Borrower | Loan Amount |
|---|---|---|---|
| Open | Mcelroy Juanita | $327,200 | |
| Previous Owner | Peak John B | $275,625 | |
| Previous Owner | Peak John B | $179,950 |
Source: Public Records
Tax History Compared to Growth
Tax History
| Year | Tax Paid | Tax Assessment Tax Assessment Total Assessment is a certain percentage of the fair market value that is determined by local assessors to be the total taxable value of land and additions on the property. | Land | Improvement |
|---|---|---|---|---|
| 2025 | $10,610 | $516,871 | -- | -- |
| 2024 | $10,308 | $501,817 | -- | -- |
| 2023 | $10,308 | $487,201 | $0 | $0 |
| 2022 | $9,460 | $473,011 | $0 | $0 |
| 2021 | $8,844 | $459,234 | $0 | $0 |
| 2020 | $7,901 | $445,859 | $0 | $0 |
| 2019 | $8,454 | $432,873 | $0 | $0 |
| 2018 | $7,604 | $420,265 | $0 | $0 |
| 2017 | $7,473 | $408,024 | $0 | $0 |
| 2016 | $7,212 | $396,140 | $0 | $0 |
| 2015 | $7,005 | $384,602 | $0 | $0 |
| 2014 | $6,540 | $373,400 | $0 | $0 |
Source: Public Records
Map
Nearby Homes
- 14341 SE Terrace Dr
- 11544 SE Highland Loop
- 11730 SE Broyles Ct
- 11550 SE Abby Ln
- 14039 SE 119th Dr
- 11867 SE Mountain Sun Dr
- 11885 SE Summers Ln
- 11985 SE Eddies Way
- 11782 SE Mountain Sun Dr
- 11484 SE Idyllwild Ct
- 12064 SE Grand Vista Dr
- 14890 SE Lostine Dr
- 12239 SE Ashley St
- 10701 SE Highway 212 Unit J3
- 10701 SE Highway 212 Unit C4
- 10701 SE Highway 212 Unit M3
- 10701 SE Highway 212 Unit H-5
- 10701 SE Highway 212 Unit OL11
- 10701 SE Highway 212 Unit W6
- 10701 SE Highway 212 Unit Y2
- 11325 SE Highland Loop
- 11309 SE Highland Loop
- 11441 SE Highland Loop
- 11447 SE Highland Loop
- 11433 SE Highland Loop
- 11333 SE Highland Loop
- 11322 SE Highland Loop
- 11316 SE Highland Loop
- 11301 SE Highland Loop
- 11455 SE Highland Loop
- 14329 SE Crestview Dr
- 11427 SE Highland Loop
- 11328 SE Highland Loop
- 11310 SE Highland Loop
- 14351 SE Crestview Dr
- 11341 SE Highland Loop
- 11442 SE Highland Loop
- 11421 SE Highland Loop
- 11436 SE Highland Loop
- 11448 SE Highland Loop