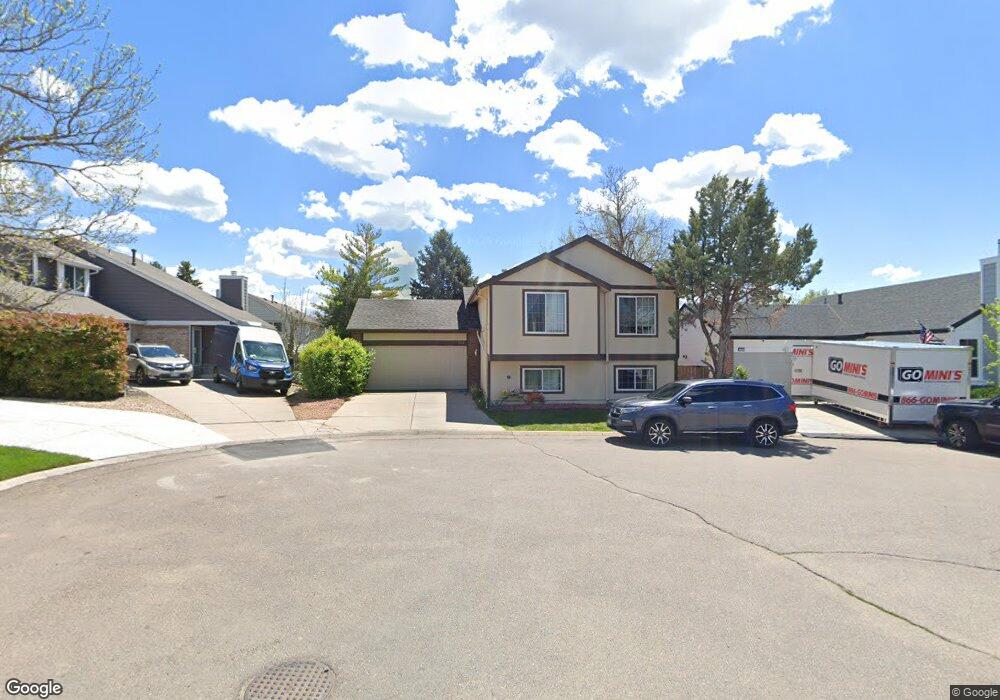
1132 Conifer Ct Highlands Ranch, CO 80126
Northridge NeighborhoodEstimated Value: $488,390 - $523,000
3
Beds
2
Baths
1,314
Sq Ft
$388/Sq Ft
Est. Value
About This Home
This home is located at 1132 Conifer Ct, Highlands Ranch, CO 80126 and is currently estimated at $509,598, approximately $387 per square foot. 1132 Conifer Ct is a home located in Douglas County with nearby schools including Northridge Elementary School, Mountain Ridge Middle School, and Mountain Vista High School.
Ownership History
Date
Name
Owned For
Owner Type
Purchase Details
Closed on
May 31, 2012
Sold by
Glodowski Diane M
Bought by
Fry Gerald R and Fry Colleen M
Current Estimated Value
Purchase Details
Closed on
Feb 26, 1997
Sold by
Wayne Schutte Todd and Mass Julie
Bought by
Glodowski Diane M
Home Financials for this Owner
Home Financials are based on the most recent Mortgage that was taken out on this home.
Original Mortgage
$125,648
Interest Rate
7.92%
Mortgage Type
FHA
Purchase Details
Closed on
Apr 20, 1992
Sold by
Kendell Gerald Boyd and Kendell Sue Ann
Bought by
Schutte Todd Wayne and Mass Julie M
Purchase Details
Closed on
Aug 25, 1989
Sold by
Kendell Gerald Boyd and Bowman Sue Ann
Bought by
Kendell Gerald Boyd and Kendell Sue Ann
Purchase Details
Closed on
Dec 13, 1988
Sold by
Swetnam Timothy C
Bought by
Kendell Gerald Boyd and Bowman Sue Ann
Purchase Details
Closed on
Apr 17, 1985
Sold by
Mission Viejo Company
Bought by
Swetnam Timothy C
Create a Home Valuation Report for This Property
The Home Valuation Report is an in-depth analysis detailing your home's value as well as a comparison with similar homes in the area
Home Values in the Area
Average Home Value in this Area
Purchase History
| Date | Buyer | Sale Price | Title Company |
|---|---|---|---|
| Fry Gerald R | $209,900 | Ats | |
| Glodowski Diane M | $126,900 | -- | |
| Schutte Todd Wayne | $87,500 | -- | |
| Kendell Gerald Boyd | -- | -- | |
| Kendell Gerald Boyd | $74,500 | -- | |
| Swetnam Timothy C | $93,400 | -- |
Source: Public Records
Mortgage History
| Date | Status | Borrower | Loan Amount |
|---|---|---|---|
| Previous Owner | Glodowski Diane M | $125,648 |
Source: Public Records
Tax History
| Year | Tax Paid | Tax Assessment Tax Assessment Total Assessment is a certain percentage of the fair market value that is determined by local assessors to be the total taxable value of land and additions on the property. | Land | Improvement |
|---|---|---|---|---|
| 2025 | $2,560 | $33,930 | $7,250 | $26,680 |
| 2024 | $2,560 | $37,550 | $8,240 | $29,310 |
| 2023 | $2,555 | $37,550 | $8,240 | $29,310 |
| 2022 | $2,372 | $25,960 | $5,710 | $20,250 |
| 2021 | $2,467 | $25,960 | $5,710 | $20,250 |
| 2020 | $2,257 | $24,330 | $5,380 | $18,950 |
| 2019 | $2,265 | $24,330 | $5,380 | $18,950 |
| 2018 | $1,940 | $20,530 | $4,780 | $15,750 |
| 2017 | $1,767 | $20,530 | $4,780 | $15,750 |
| 2016 | $1,642 | $18,730 | $3,710 | $15,020 |
| 2015 | $839 | $18,730 | $3,710 | $15,020 |
| 2014 | $768 | $15,840 | $3,500 | $12,340 |
Source: Public Records
Map
Nearby Homes
- 9364 Cattail Ct
- 9317 Rosewood Ct
- 805 Summer Dr Unit 805
- 819 Summer Dr Unit 5D
- 9192 Stargrass Cir
- 9222 Crestmore Way
- 889 Summer Dr Unit 14
- 639 Walden Ct
- 839 Summer Dr Unit 1F
- 455 Saddlewood Cir
- 765 Stowe St
- 581 Longfellow Ln
- 9240 Stargrass Cir
- 508 Longfellow Ln
- 8971 Winrock St
- 556 Longfellow Ln
- 890 Garden Dr
- 9421 Crestmore Way
- 381 Mountain Cloud Cir
- 935 Brittany Way
- 1099 Ridgeglen Way
- 1162 Conifer Ct
- 1069 Ridgeglen Way
- 1129 Ridgeglen Way
- 1192 Conifer Ct
- 952 Conifer Ct
- 922 Conifer Ct
- 1191 Conifer Ct
- 1159 Ridgeglen Way
- 1131 Conifer Ct
- 1101 Conifer Ct
- 0 Conifer Ct
- 1161 Conifer Ct
- 1071 Conifer Ct
- 9055 Laurel Ct
- 9075 Laurel Ct
- 1100R Ridgeglen Way
- 9035 Laurel Ct
- 1100 Ridgeglen Way
- 1189 Ridgeglen Way
Your Personal Tour Guide
Ask me questions while you tour the home.