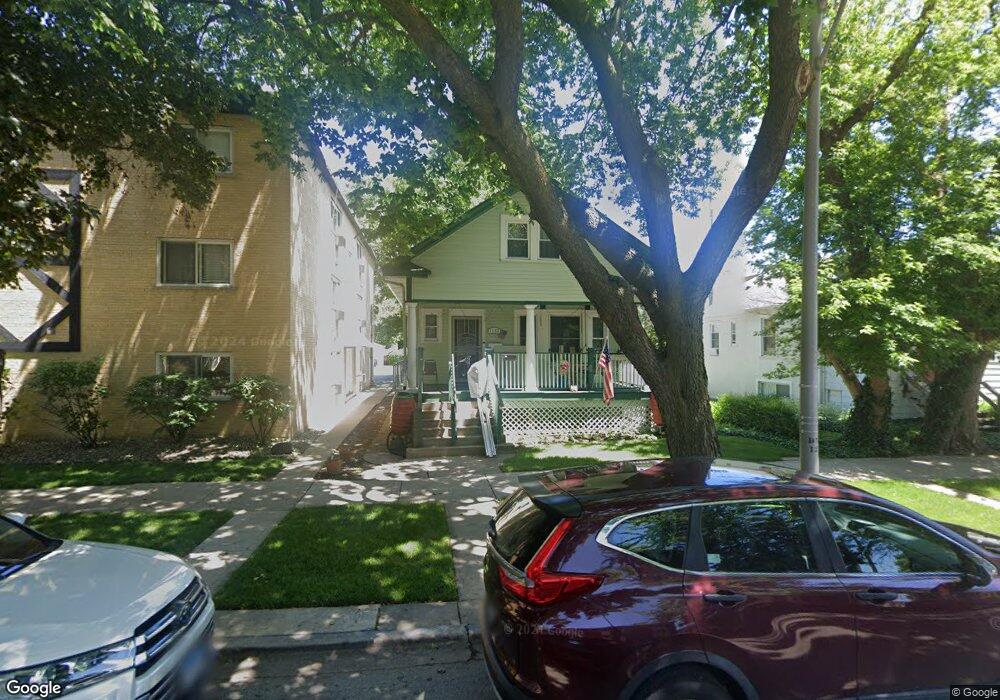
1132 Dunlop Ave Forest Park, IL 60130
Estimated Value: $297,000 - $364,000
3
Beds
2
Baths
1,460
Sq Ft
$227/Sq Ft
Est. Value
About This Home
This home is located at 1132 Dunlop Ave, Forest Park, IL 60130 and is currently estimated at $331,591, approximately $227 per square foot. 1132 Dunlop Ave is a home located in Cook County with nearby schools including Garfield Elementary School, Field Stevenson Elementary School, and Betsy Ross Elementary School.
Ownership History
Date
Name
Owned For
Owner Type
Purchase Details
Closed on
Feb 22, 2024
Sold by
Roland Cecily A
Bought by
Roland And Mikalajunas Revocable Trust and Roland
Current Estimated Value
Purchase Details
Closed on
Jul 24, 2000
Sold by
Petersen Darrell J and Cipicchio Nicolette M
Bought by
Mikalajunas Peter J and Roland Cecily A
Home Financials for this Owner
Home Financials are based on the most recent Mortgage that was taken out on this home.
Original Mortgage
$140,500
Interest Rate
8.27%
Purchase Details
Closed on
Nov 21, 1997
Sold by
Trainor Matthew G and Trainor Anita E
Bought by
Petersen Darrell J and Cipicchio Nicolette M
Home Financials for this Owner
Home Financials are based on the most recent Mortgage that was taken out on this home.
Original Mortgage
$104,800
Interest Rate
7.38%
Create a Home Valuation Report for This Property
The Home Valuation Report is an in-depth analysis detailing your home's value as well as a comparison with similar homes in the area
Home Values in the Area
Average Home Value in this Area
Purchase History
| Date | Buyer | Sale Price | Title Company |
|---|---|---|---|
| Roland And Mikalajunas Revocable Trust | -- | None Listed On Document | |
| Mikalajunas Peter J | $160,500 | Chicago Title Insurance Co | |
| Petersen Darrell J | $131,000 | Prairie Title |
Source: Public Records
Mortgage History
| Date | Status | Borrower | Loan Amount |
|---|---|---|---|
| Previous Owner | Mikalajunas Peter J | $140,500 | |
| Previous Owner | Petersen Darrell J | $104,800 |
Source: Public Records
Tax History Compared to Growth
Tax History
| Year | Tax Paid | Tax Assessment Tax Assessment Total Assessment is a certain percentage of the fair market value that is determined by local assessors to be the total taxable value of land and additions on the property. | Land | Improvement |
|---|---|---|---|---|
| 2024 | $6,617 | $28,001 | $5,063 | $22,938 |
| 2023 | $5,036 | $28,001 | $5,063 | $22,938 |
| 2022 | $5,036 | $20,208 | $3,881 | $16,327 |
| 2021 | $4,839 | $20,207 | $3,881 | $16,326 |
| 2020 | $4,851 | $20,207 | $3,881 | $16,326 |
| 2019 | $5,451 | $21,654 | $3,543 | $18,111 |
| 2018 | $5,335 | $21,654 | $3,543 | $18,111 |
| 2017 | $5,254 | $21,654 | $3,543 | $18,111 |
| 2016 | $5,748 | $18,538 | $3,206 | $15,332 |
| 2015 | $5,614 | $18,538 | $3,206 | $15,332 |
| 2014 | $5,527 | $18,538 | $3,206 | $15,332 |
| 2013 | $5,776 | $20,489 | $3,206 | $17,283 |
Source: Public Records
Map
Nearby Homes
- 1124 Lathrop Ave
- 1115 Ferdinand Ave
- 7742 Taylor St
- 1008 Lathrop Ave
- 1013 Ferdinand Ave
- 1024 Ferdinand Ave
- 1007 Ferdinand Ave
- 940 Troost Ave
- 946 Ferdinand Ave
- 1118 Thomas Ave
- 944 Beloit Ave Unit 4
- 944 Beloit Ave Unit 5
- 944 Beloit Ave Unit 1
- 944 Beloit Ave Unit 2
- 915 Ferdinand Ave
- 900 Dunlop Ave
- 900 Lathrop Ave
- 1103 Circle Ave
- 1042 Circle Ave
- 1225 Marengo Ave
- 1134 Dunlop Ave
- 1130 Dunlop Ave Unit 2D
- 1130 Dunlop Ave Unit 2B
- 1130 Dunlop Ave Unit 1C
- 1130 Dunlop Ave Unit 1B
- 1130 Dunlop Ave Unit 2C
- 1130 Dunlop Ave Unit 3B
- 1130 Dunlop Ave Unit 1A
- 1130 Dunlop Ave Unit 3D
- 1130 Dunlop Ave Unit 3A
- 1130 Dunlop Ave Unit 1D
- 1130 Dunlop Ave Unit 2A
- 1130 Dunlop Ave Unit 2C
- 1124 Dunlop Ave Unit 2D
- 1124 Dunlop Ave Unit 2B
- 1124 Dunlop Ave Unit 3B
- 1124 Dunlop Ave Unit 2C
- 1124 Dunlop Ave Unit 1B
- 1124 Dunlop Ave Unit 3A
- 1124 Dunlop Ave Unit 1C