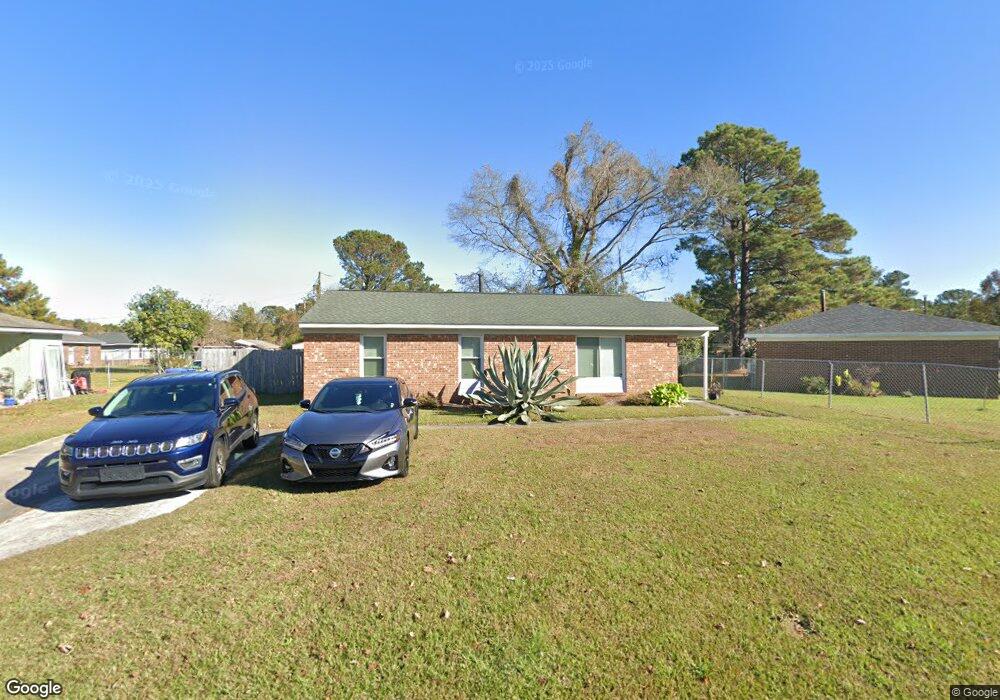
1132 E Stewart Cir Wilmington, NC 28405
Estimated Value: $174,000 - $239,000
3
Beds
1
Bath
1,040
Sq Ft
$198/Sq Ft
Est. Value
About This Home
This home is located at 1132 E Stewart Cir, Wilmington, NC 28405 and is currently estimated at $206,261, approximately $198 per square foot. 1132 E Stewart Cir is a home located in New Hanover County with nearby schools including Rachel Freeman School of Engineering, Holly Shelter Middle School, and Emsley A. Laney High School.
Ownership History
Date
Name
Owned For
Owner Type
Purchase Details
Closed on
Nov 6, 2006
Sold by
Fisher James and Fisher Mary M
Bought by
Spears Terrence
Current Estimated Value
Home Financials for this Owner
Home Financials are based on the most recent Mortgage that was taken out on this home.
Original Mortgage
$95,000
Outstanding Balance
$56,217
Interest Rate
6.31%
Mortgage Type
Purchase Money Mortgage
Estimated Equity
$150,044
Purchase Details
Closed on
Feb 28, 2006
Sold by
Barbour Corey and Barbour Walter L
Bought by
Fisher James Boyd and Fisher Mary Mona
Purchase Details
Closed on
May 27, 2004
Sold by
Wells Fargo Bank Mn Na
Bought by
Barbour Corey
Purchase Details
Closed on
Jan 6, 2004
Sold by
Kellam & Pettit Sub Trustee
Bought by
Wells Fargo Bank Mn Na
Purchase Details
Closed on
Nov 27, 1979
Sold by
Housing Authority City Wilm
Bought by
Bragg Edward L Jr Sarah H
Create a Home Valuation Report for This Property
The Home Valuation Report is an in-depth analysis detailing your home's value as well as a comparison with similar homes in the area
Home Values in the Area
Average Home Value in this Area
Purchase History
| Date | Buyer | Sale Price | Title Company |
|---|---|---|---|
| Spears Terrence | $95,000 | None Available | |
| Fisher James Boyd | $65,000 | None Available | |
| Barbour Corey | $38,500 | -- | |
| Wells Fargo Bank Mn Na | $29,000 | -- | |
| Bragg Edward L Jr Sarah H | -- | -- |
Source: Public Records
Mortgage History
| Date | Status | Borrower | Loan Amount |
|---|---|---|---|
| Open | Spears Terrence | $95,000 |
Source: Public Records
Tax History Compared to Growth
Tax History
| Year | Tax Paid | Tax Assessment Tax Assessment Total Assessment is a certain percentage of the fair market value that is determined by local assessors to be the total taxable value of land and additions on the property. | Land | Improvement |
|---|---|---|---|---|
| 2025 | $1,054 | $196,500 | $42,100 | $154,400 |
| 2023 | $1,054 | $121,200 | $49,800 | $71,400 |
| 2022 | $1,030 | $121,200 | $49,800 | $71,400 |
| 2021 | $1,037 | $121,200 | $49,800 | $71,400 |
| 2020 | $669 | $63,500 | $22,500 | $41,000 |
| 2019 | $669 | $63,500 | $22,500 | $41,000 |
| 2018 | $669 | $63,500 | $22,500 | $41,000 |
| 2017 | $669 | $63,500 | $22,500 | $41,000 |
| 2016 | $802 | $72,400 | $27,000 | $45,400 |
| 2015 | $767 | $72,400 | $27,000 | $45,400 |
| 2014 | $734 | $72,400 | $27,000 | $45,400 |
Source: Public Records
Map
Nearby Homes
- 1101 Emory St
- 1122 E Stewart Cir
- 1106 E Stewart Cir
- 2603 McClammy St
- 2604 Robeson St
- 1604 Kornegay Ave
- 1602 Forbes Ct
- 421 Evans St
- 431 Henry St
- 468 Maides Ave
- 464 Maides Ave
- 460 Maides Ave
- 2926 Princess Place Dr
- 3896 Tiffany Dr
- 109 & 113 Clay St
- 505 N 25th St
- 222 Evans St
- 607 Sharease Cir
- 2402 Belvedere Dr
- 1134 E Stewart Cir
- 1104 Emory St
- 2903 Cooper Ct
- 2904 Spaulding Dr
- 2901 Cooper Ct
- 2906 Spaulding Dr
- 2905 Cooper Ct
- 1131 E Stewart Cir
- 1133 E Stewart Cir
- 1127 E Stewart Cir
- 1105 Emory St
- 2908 Spaulding Dr
- 1103 Emory St Unit 505
- 2804 Spaulding Dr
- 1128 E Stewart Cir
- 2901 Spaulding Dr
- 2903 Spaulding Dr
- 2907 Cooper Ct
- 1123 E Stewart Cir
- 2807 Spaulding Dr