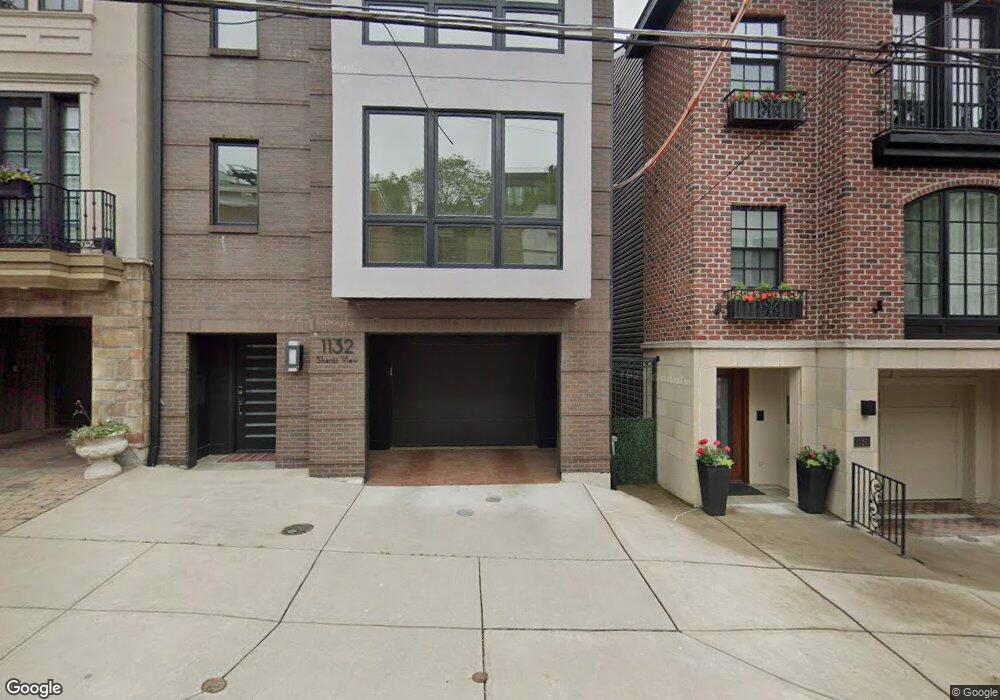
1132 Fort View Place Cincinnati, OH 45202
Mount Adams NeighborhoodEstimated Value: $1,425,000 - $1,891,000
2
Beds
2
Baths
4,278
Sq Ft
$401/Sq Ft
Est. Value
About This Home
This home is located at 1132 Fort View Place, Cincinnati, OH 45202 and is currently estimated at $1,716,471, approximately $401 per square foot. 1132 Fort View Place is a home located in Hamilton County with nearby schools including Robert A. Taft Information Technology High School, Withrow University High School, and Clark Montessori High School.
Ownership History
Date
Name
Owned For
Owner Type
Purchase Details
Closed on
Mar 11, 2013
Sold by
Greenview Homes Ltd
Bought by
Brendamour Reeta H and Reeta H Brendamour Trust
Current Estimated Value
Purchase Details
Closed on
Jun 13, 2011
Sold by
Fort View Realty Llc
Bought by
Greenview Homes Ltd
Purchase Details
Closed on
Mar 10, 2006
Sold by
Cohen Floyd
Bought by
Fort View Realty Llc
Purchase Details
Closed on
Aug 14, 1998
Sold by
Cohen Mary Jo
Bought by
Cohen Floyd
Purchase Details
Closed on
Nov 24, 1995
Sold by
Strauss Dana Maher
Bought by
Cohen Floyd and Cohen Mary Jo
Create a Home Valuation Report for This Property
The Home Valuation Report is an in-depth analysis detailing your home's value as well as a comparison with similar homes in the area
Home Values in the Area
Average Home Value in this Area
Purchase History
| Date | Buyer | Sale Price | Title Company |
|---|---|---|---|
| Brendamour Reeta H | -- | None Available | |
| Greenview Homes Ltd | $275,000 | None Available | |
| Schwartz Abby S | $275,000 | None Available | |
| Fort View Realty Llc | -- | None Available | |
| Cohen Floyd | -- | -- | |
| Cohen Floyd | -- | -- |
Source: Public Records
Tax History Compared to Growth
Tax History
| Year | Tax Paid | Tax Assessment Tax Assessment Total Assessment is a certain percentage of the fair market value that is determined by local assessors to be the total taxable value of land and additions on the property. | Land | Improvement |
|---|---|---|---|---|
| 2024 | $18,829 | $524,920 | $118,965 | $405,955 |
| 2023 | $19,256 | $524,920 | $118,965 | $405,955 |
| 2022 | $16,070 | $445,484 | $114,639 | $330,845 |
| 2021 | $15,475 | $445,484 | $114,639 | $330,845 |
| 2020 | $15,930 | $445,484 | $114,639 | $330,845 |
| 2019 | $15,556 | $420,266 | $108,150 | $312,116 |
| 2018 | $15,580 | $420,266 | $108,150 | $312,116 |
| 2017 | $14,802 | $420,266 | $108,150 | $312,116 |
| 2016 | $17,734 | $463,751 | $147,466 | $316,285 |
| 2015 | $31,223 | $463,751 | $147,466 | $316,285 |
| 2014 | $9,985 | $147,466 | $147,466 | $0 |
| 2013 | $6,631 | $96,250 | $96,250 | $0 |
Source: Public Records
Map
Nearby Homes
- 1040 Hatch St Unit 11
- 1026 Hatch St
- 1000 Paradrome St
- 1140 Carney St
- 1136 Carney St
- 1126 Carney St
- 981 Hatch St
- 971 Parkside Place
- 1005 Hill St
- 1112 Fuller St
- 961 Hatch St
- 1109 Fuller St
- 1125 Belvedere St
- 955 Pavilion St
- 953 Hill St
- 913 Paradrome St
- 1054 Saint Paul Place
- 1233 Ida St
- 1464 Riverside Dr
- 909 Riverview Place
- 1134 Fort View Place
- 1130 Fort View Place
- 1136 Fort View Place
- 1138 Fort View Place
- 1126 Fort View Place
- 1140 Fort View Place
- C Fort View Place
- 1124 Fort View Place
- 1124 Fort View Place
- 1124 Fort View Place
- 1124 Fort View Place Unit C
- 1142 Fort View Place
- 1133 Fort View Place
- 1135 Fort View Place
- 1131 Fort View Place
- 1007 Hatch St
- 1003 Hatch St
- 1001 Hatch St
- 1001 Hatch St Unit ID1056124P
- 1125 Fort View Place