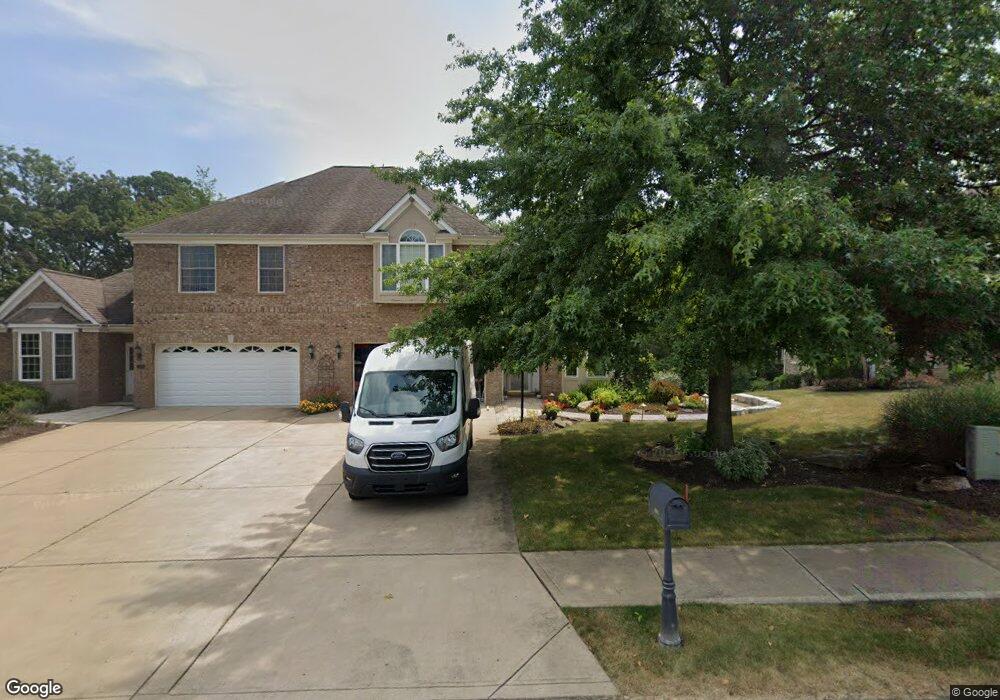
1132 Lilly Vue Ct Mars, PA 16046
Adams Township NeighborhoodEstimated Value: $676,000 - $845,700
3
Beds
4
Baths
3,050
Sq Ft
$239/Sq Ft
Est. Value
About This Home
This home is located at 1132 Lilly Vue Ct, Mars, PA 16046 and is currently estimated at $728,675, approximately $238 per square foot. 1132 Lilly Vue Ct is a home located in Butler County with nearby schools including Mars Area Primary Center, Mars Area Elementary School, and Mars Area Centennial School.
Ownership History
Date
Name
Owned For
Owner Type
Purchase Details
Closed on
Oct 31, 2014
Sold by
Hughes Michael F
Bought by
Mastovich George T
Current Estimated Value
Home Financials for this Owner
Home Financials are based on the most recent Mortgage that was taken out on this home.
Original Mortgage
$352,800
Outstanding Balance
$272,040
Interest Rate
4.18%
Mortgage Type
New Conventional
Estimated Equity
$456,635
Purchase Details
Closed on
Feb 21, 2008
Sold by
Burk Edward R
Bought by
Hughes Michael F
Home Financials for this Owner
Home Financials are based on the most recent Mortgage that was taken out on this home.
Original Mortgage
$386,460
Interest Rate
5.94%
Mortgage Type
New Conventional
Purchase Details
Closed on
Jul 19, 2006
Sold by
Series D Marketing
Bought by
Burk Edward R
Home Financials for this Owner
Home Financials are based on the most recent Mortgage that was taken out on this home.
Original Mortgage
$216,266
Interest Rate
6.67%
Mortgage Type
New Conventional
Create a Home Valuation Report for This Property
The Home Valuation Report is an in-depth analysis detailing your home's value as well as a comparison with similar homes in the area
Home Values in the Area
Average Home Value in this Area
Purchase History
| Date | Buyer | Sale Price | Title Company |
|---|---|---|---|
| Mastovich George T | $441,000 | -- | |
| Hughes Michael F | $406,800 | -- | |
| Burk Edward R | $416,266 | -- |
Source: Public Records
Mortgage History
| Date | Status | Borrower | Loan Amount |
|---|---|---|---|
| Open | Mastovich George T | $352,800 | |
| Previous Owner | Hughes Michael F | $386,460 | |
| Previous Owner | Burk Edward R | $216,266 |
Source: Public Records
Tax History Compared to Growth
Tax History
| Year | Tax Paid | Tax Assessment Tax Assessment Total Assessment is a certain percentage of the fair market value that is determined by local assessors to be the total taxable value of land and additions on the property. | Land | Improvement |
|---|---|---|---|---|
| 2025 | $5,729 | $40,810 | $1,640 | $39,170 |
| 2024 | $5,587 | $40,810 | $1,640 | $39,170 |
| 2023 | $5,392 | $40,620 | $1,640 | $38,980 |
| 2022 | $5,392 | $40,620 | $1,640 | $38,980 |
| 2021 | $5,392 | $40,620 | $0 | $0 |
| 2020 | $5,392 | $40,620 | $1,640 | $38,980 |
| 2019 | $5,392 | $40,620 | $1,640 | $38,980 |
| 2018 | $5,296 | $40,620 | $1,640 | $38,980 |
| 2017 | $5,296 | $40,620 | $1,640 | $38,980 |
| 2016 | $1,402 | $40,620 | $1,640 | $38,980 |
| 2015 | $824 | $40,620 | $1,640 | $38,980 |
| 2014 | $824 | $40,620 | $1,640 | $38,980 |
Source: Public Records
Map
Nearby Homes
- 3001 Greeneview Ln
- 4502 Senate Ct
- 1797 Constitution Blvd
- 124 Oak Ln
- 402 Providence Ct
- 1153 Cobblestone Ln
- 107 E School St
- 301 Stately Ct
- Hanover Plan at Sunrise Acres
- Hadley Plan at Sunrise Acres
- 1301 Shinnecock Ct
- 219 Morning Grove Ln
- 216 Morning Grove Ln
- 906 Big Bear Ct
- 320 Stately Ct
- 328 Stately Ct
- 327 Stately Ct
- 323 Stately Ct
- 1004 Amy Place
- 337 Stately Ct
- 1131 Lilly Vue Ct
- 1121 Lilly Vue Ct
- 1142 Lilly Vue Ct
- 1122 Lilly Vue Ct
- 1141 Lilly Vue Ct
- 1151 Lilly Vue Ct
- 1111 Lilly Vue Ct
- 1152 Lilly Vue Ct
- 1112 Lilly Vue Ct
- 1162 Lilly Vue Ct
- 1161 Lilly Vue Ct
- 1101 Lilly Vue Ct
- 1102 Lilly Vue Ct
- 2062 Gables Ct
- 1091 Lilly Vue Ct
- 2061 Gables Ct
- 2051 Gables Ct
- 1092 Lilly Vue Ct
- 3011 Edelweiss Ct
- 2072 Gables Ct