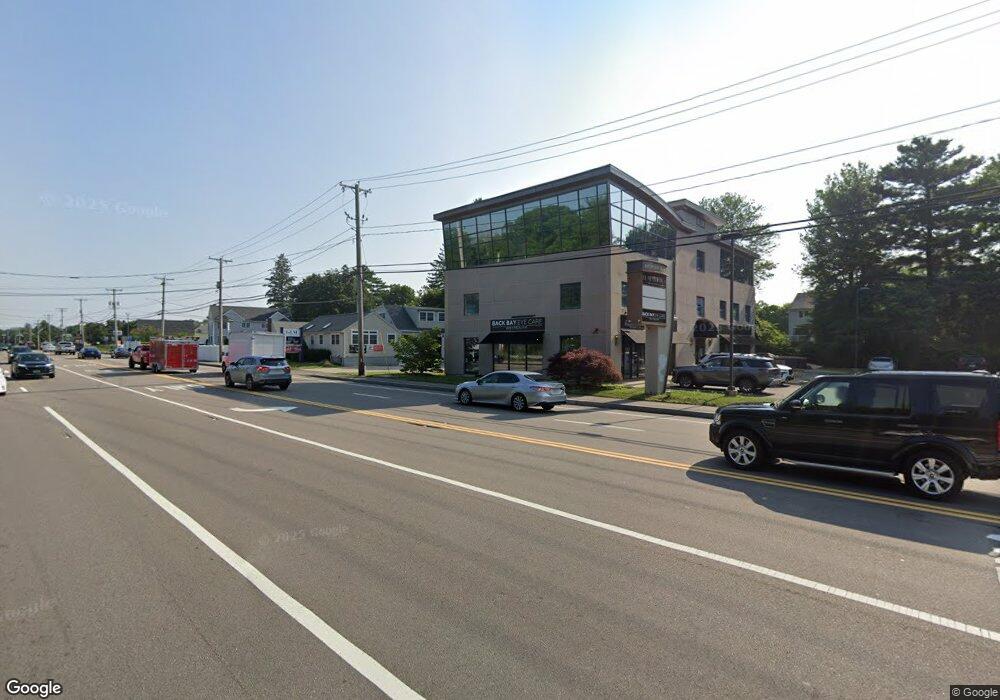
1132 Main St Weymouth, MA 02190
South Weymouth NeighborhoodEstimated Value: $2,172,619
--
Bed
6
Baths
2,771
Sq Ft
$784/Sq Ft
Est. Value
About This Home
This home is located at 1132 Main St, Weymouth, MA 02190 and is currently estimated at $2,172,619, approximately $784 per square foot. 1132 Main St is a home located in Norfolk County with nearby schools including Thomas W. Hamilton Primary School, Abigail Adams Middle School, and Weymouth Middle School Chapman.
Ownership History
Date
Name
Owned For
Owner Type
Purchase Details
Closed on
Aug 2, 2021
Sold by
Nina Rt
Bought by
Lau Sinyu and Lin Tao
Current Estimated Value
Home Financials for this Owner
Home Financials are based on the most recent Mortgage that was taken out on this home.
Original Mortgage
$1,440,000
Outstanding Balance
$1,309,994
Interest Rate
2.93%
Mortgage Type
Purchase Money Mortgage
Estimated Equity
$862,625
Purchase Details
Closed on
May 16, 2003
Sold by
Matthew J Toia Ret and Toia Matthew J
Bought by
Nina Rt and Dickinson Anita M
Create a Home Valuation Report for This Property
The Home Valuation Report is an in-depth analysis detailing your home's value as well as a comparison with similar homes in the area
Home Values in the Area
Average Home Value in this Area
Purchase History
| Date | Buyer | Sale Price | Title Company |
|---|---|---|---|
| Lau Sinyu | $1,800,000 | None Available | |
| Nina Rt | $385,000 | -- |
Source: Public Records
Mortgage History
| Date | Status | Borrower | Loan Amount |
|---|---|---|---|
| Open | Lau Sinyu | $1,440,000 |
Source: Public Records
Tax History Compared to Growth
Tax History
| Year | Tax Paid | Tax Assessment Tax Assessment Total Assessment is a certain percentage of the fair market value that is determined by local assessors to be the total taxable value of land and additions on the property. | Land | Improvement |
|---|---|---|---|---|
| 2025 | $30,913 | $1,935,700 | $285,200 | $1,650,500 |
| 2024 | $30,319 | $1,863,500 | $271,500 | $1,592,000 |
| 2023 | $29,626 | $1,795,500 | $258,600 | $1,536,900 |
| 2022 | $32,481 | $1,769,100 | $241,700 | $1,527,400 |
| 2021 | $32,738 | $1,780,200 | $234,600 | $1,545,600 |
| 2020 | $33,209 | $1,775,900 | $234,600 | $1,541,300 |
| 2019 | $33,252 | $1,745,500 | $225,600 | $1,519,900 |
| 2018 | $33,087 | $1,682,100 | $204,300 | $1,477,800 |
| 2017 | $33,209 | $1,644,000 | $199,400 | $1,444,600 |
| 2016 | $36,322 | $1,720,600 | $191,700 | $1,528,900 |
| 2015 | $37,661 | $1,693,400 | $191,700 | $1,501,700 |
| 2014 | $36,708 | $1,691,600 | $188,700 | $1,502,900 |
Source: Public Records
Map
Nearby Homes
- 55 Greentree Ln Unit 19
- 7 Woodcrest Ct Unit 4
- 8 Woodcrest Ct Unit 4
- 11 Woodcrest Ct Unit 5
- 10 Woodcrest Ct Unit 4
- 60 Greentree Ln Unit 38
- 18 Fountain Ln Unit 2
- 50 Hollis St
- 120 Randolph St
- 102 White St
- 45 Union St
- 25 Skyhawk Cir
- 1 Sparrow Green
- 82 Snowbird Ave
- 193 Randolph St
- 130 Trotter Rd Unit 1309
- 130 Trotter Rd Unit 1211
- 25 Wales Ave
- 211 Randolph St
- 299 Union St
- 1132 Main St Unit 3
- 1132 Main St Unit 2
- 1132 Main St Unit 1
- 8 Webster St
- 8 Webster St Unit 8
- 22 Webster St
- 24 Webster St
- 18 Webster St
- 20 Webster St
- 20 Webster St Unit 20
- 26 Webster St
- 16 Webster St
- 14 Webster St
- 12 Webster St
- 10 Webster St
- 10 Webster St Unit 10
- 16 Webster St
- 16 Webster St Unit 16,1
- 12 Webster St Unit 12
- 1121 Main St Unit 3