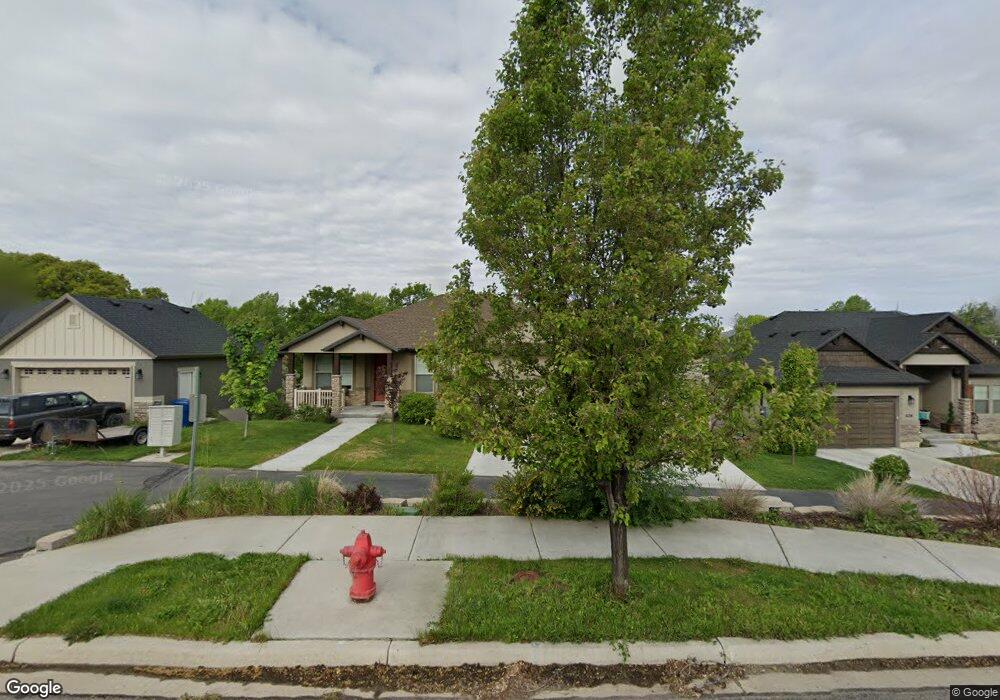
1132 S 590 E Payson, UT 84651
Estimated Value: $584,960 - $606,000
3
Beds
3
Baths
1,738
Sq Ft
$344/Sq Ft
Est. Value
About This Home
This home is located at 1132 S 590 E, Payson, UT 84651 and is currently estimated at $597,987, approximately $344 per square foot. 1132 S 590 E is a home with nearby schools including Park View Elementary, Payson High School, and Payson Junior High School.
Ownership History
Date
Name
Owned For
Owner Type
Purchase Details
Closed on
Dec 4, 2019
Sold by
Lovejoy Bruce Neal and Creer Lovejoy Susan Ludlow
Bought by
Lovejoy Bruce Neal and Creer Lovejoy Susan Ludlow
Current Estimated Value
Purchase Details
Closed on
Mar 18, 2016
Sold by
Lovejoy Bruce Neal
Bought by
Lovejoy Bruce Neal and Creer Lovejoy Susan Ludlow
Purchase Details
Closed on
Apr 1, 2014
Sold by
Arive Homes Llc
Bought by
Lovejoy Bruce Neal
Home Financials for this Owner
Home Financials are based on the most recent Mortgage that was taken out on this home.
Original Mortgage
$241,402
Interest Rate
4.3%
Mortgage Type
New Conventional
Purchase Details
Closed on
Mar 10, 2014
Sold by
Hidden Grove Llc
Bought by
Arive Homes Llc
Home Financials for this Owner
Home Financials are based on the most recent Mortgage that was taken out on this home.
Original Mortgage
$241,402
Interest Rate
4.3%
Mortgage Type
New Conventional
Create a Home Valuation Report for This Property
The Home Valuation Report is an in-depth analysis detailing your home's value as well as a comparison with similar homes in the area
Home Values in the Area
Average Home Value in this Area
Purchase History
| Date | Buyer | Sale Price | Title Company |
|---|---|---|---|
| Lovejoy Bruce Neal | -- | None Available | |
| Lovejoy Bruce Neal | -- | None Available | |
| Lovejoy Bruce Neal | -- | Provo Land Title Co | |
| Arive Homes Llc | -- | Provo Land Title Co |
Source: Public Records
Mortgage History
| Date | Status | Borrower | Loan Amount |
|---|---|---|---|
| Previous Owner | Lovejoy Bruce Neal | $241,402 |
Source: Public Records
Tax History
| Year | Tax Paid | Tax Assessment Tax Assessment Total Assessment is a certain percentage of the fair market value that is determined by local assessors to be the total taxable value of land and additions on the property. | Land | Improvement |
|---|---|---|---|---|
| 2025 | $2,849 | $296,560 | -- | -- |
| 2024 | $2,849 | $289,905 | $0 | $0 |
| 2023 | $2,903 | $296,230 | $0 | $0 |
| 2022 | $2,859 | $286,990 | $0 | $0 |
| 2021 | $2,418 | $389,300 | $99,100 | $290,200 |
| 2020 | $2,297 | $361,800 | $90,100 | $271,700 |
| 2019 | $2,147 | $346,700 | $85,900 | $260,800 |
| 2018 | $2,038 | $317,200 | $73,900 | $243,300 |
| 2017 | $1,915 | $160,270 | $0 | $0 |
| 2016 | $1,839 | $152,900 | $0 | $0 |
| 2015 | $1,783 | $147,235 | $0 | $0 |
| 2014 | $941 | $78,265 | $0 | $0 |
Source: Public Records
Map
Nearby Homes
- 336 E 1330 S
- 288 E 900 S
- 876 Greenridge Ave
- 582 E 1250 S Unit 137
- 346 Jay Ln
- 900 S Goosenest Dr
- 252 E 670 S Unit 2
- 420 E 600 S
- 229 E 670 S Unit 7
- 551 E 500 S
- 88 W 700 S
- 412 S Goosenest Dr
- 426 S Goosenest Dr
- 753 N Emery Ln Unit 57
- 678 N Mountain View Dr
- 552 E Longview Dr Unit 29
- 348 E Dr E Unit 26
- 5620 W 8800 S Unit 2
- 643 E Longview Dr Unit 8
- 337 W 100 S
- 1136 S 590 E Unit 4
- 1144 S 590 E Unit 5
- 1146 S 590 E Unit 5
- 1126 S 590 E Unit 3
- 1116 S 590 E Unit 2
- 1114 S 590 E
- 1169 S 600 E
- 1176 S 590 E
- 1176 S 590 E Unit 7
- 1176 S 590 E Unit 7-A
- 1106 S 590 E
- 1167 S 600 E
- 1183 S 590 E Unit 15
- 1155 S 550 E
- 1186 S 590 E
- 1165 S 600 E
- 1175 S 590 E Unit 17
- 1129 S 550 E Unit 18
- 1179 S 550 E Unit 14
- 1197 S 590 E Unit 13
Your Personal Tour Guide
Ask me questions while you tour the home.