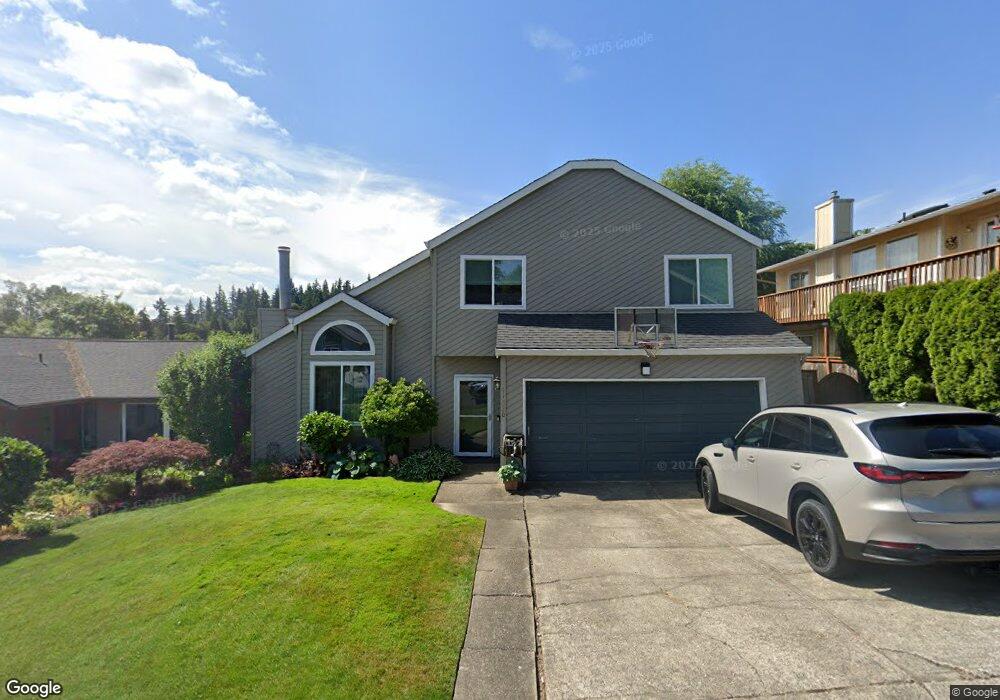
11320 SE Abby Ln Clackamas, OR 97015
Estimated Value: $504,436 - $548,000
3
Beds
3
Baths
1,836
Sq Ft
$290/Sq Ft
Est. Value
About This Home
This home is located at 11320 SE Abby Ln, Clackamas, OR 97015 and is currently estimated at $532,609, approximately $290 per square foot. 11320 SE Abby Ln is a home located in Clackamas County with nearby schools including Sunnyside Elementary School, Rock Creek Middle School, and Clackamas High School.
Ownership History
Date
Name
Owned For
Owner Type
Purchase Details
Closed on
Oct 14, 2008
Sold by
Bowen Enterprises Inc
Bought by
Fillis Anna J and Hansen Samuel J
Current Estimated Value
Home Financials for this Owner
Home Financials are based on the most recent Mortgage that was taken out on this home.
Original Mortgage
$246,391
Outstanding Balance
$162,228
Interest Rate
6.31%
Mortgage Type
FHA
Estimated Equity
$370,381
Purchase Details
Closed on
Jun 11, 2007
Sold by
Garner Miacheal
Bought by
Bowen Enterprises Inc
Purchase Details
Closed on
Apr 5, 2006
Sold by
Brown Debora K
Bought by
Garner Micheal
Home Financials for this Owner
Home Financials are based on the most recent Mortgage that was taken out on this home.
Original Mortgage
$53,400
Interest Rate
6.25%
Mortgage Type
Stand Alone Second
Purchase Details
Closed on
May 27, 1997
Sold by
Mathes Ronald L and Mathes Paula J
Bought by
Brown Debora K
Home Financials for this Owner
Home Financials are based on the most recent Mortgage that was taken out on this home.
Original Mortgage
$125,950
Interest Rate
8.13%
Create a Home Valuation Report for This Property
The Home Valuation Report is an in-depth analysis detailing your home's value as well as a comparison with similar homes in the area
Home Values in the Area
Average Home Value in this Area
Purchase History
| Date | Buyer | Sale Price | Title Company |
|---|---|---|---|
| Fillis Anna J | $250,000 | Lawyers Title Ins | |
| Bowen Enterprises Inc | $229,346 | None Available | |
| Garner Micheal | $267,000 | Ticor Title Insurance Compan | |
| Brown Debora K | $157,450 | Stewart Title |
Source: Public Records
Mortgage History
| Date | Status | Borrower | Loan Amount |
|---|---|---|---|
| Open | Fillis Anna J | $246,391 | |
| Previous Owner | Garner Micheal | $53,400 | |
| Previous Owner | Garner Micheal | $213,600 | |
| Previous Owner | Brown Debora K | $125,950 |
Source: Public Records
Tax History Compared to Growth
Tax History
| Year | Tax Paid | Tax Assessment Tax Assessment Total Assessment is a certain percentage of the fair market value that is determined by local assessors to be the total taxable value of land and additions on the property. | Land | Improvement |
|---|---|---|---|---|
| 2025 | $5,356 | $280,647 | -- | -- |
| 2024 | $5,167 | $272,473 | -- | -- |
| 2023 | $5,167 | $264,537 | $0 | $0 |
| 2022 | $4,754 | $256,833 | $0 | $0 |
| 2021 | $4,581 | $249,353 | $0 | $0 |
| 2020 | $4,311 | $242,091 | $0 | $0 |
| 2019 | $4,255 | $235,040 | $0 | $0 |
| 2018 | $3,833 | $228,194 | $0 | $0 |
| 2017 | $3,712 | $221,548 | $0 | $0 |
| 2016 | $3,581 | $215,095 | $0 | $0 |
| 2015 | $3,480 | $208,830 | $0 | $0 |
| 2014 | $3,230 | $202,748 | $0 | $0 |
Source: Public Records
Map
Nearby Homes
- 11550 SE Abby Ln
- 14341 SE Terrace Dr
- 14039 SE 119th Dr
- 11544 SE Highland Loop
- 11484 SE Idyllwild Ct
- 11985 SE Eddies Way
- 11885 SE Summers Ln
- 11730 SE Broyles Ct
- 11867 SE Mountain Sun Dr
- 12239 SE Ashley St
- 11782 SE Mountain Sun Dr
- 14890 SE Lostine Dr
- 12064 SE Grand Vista Dr
- 12651 SE 123rd Ave
- 12533 SE Sunnyside Rd
- 12245 SE Quietwoods St
- 10160 SE Talbert St Unit 10160
- 10186 SE Talbert St Unit 10186
- 16180 SE Sunnyside Rd
- 12452 SE 110th Ct Unit 117
- 11340 SE Abby Ln
- 11300 SE Abby Ln
- 13940 SE 113th Ct
- 13945 SE 113th Ct
- 11360 SE Abby Ln
- 11327 SE Abby Ln
- 11307 SE Abby Ln
- 13952 SE 113th Ct
- 11380 SE Abby Ln
- 13953 SE 113th Ct
- 11367 SE Abby Ln
- 11375 SE Mather Rd
- 13956 SE 113th Ct
- 11393 SE Mather Rd
- 11387 SE Abby Ln
- 11311 SE Mather Rd
- 11400 SE Abby Ln
- 11308 SE Falbrook Dr
- 11314 SE Falbrook Dr
- 13947 SE 114th Ct