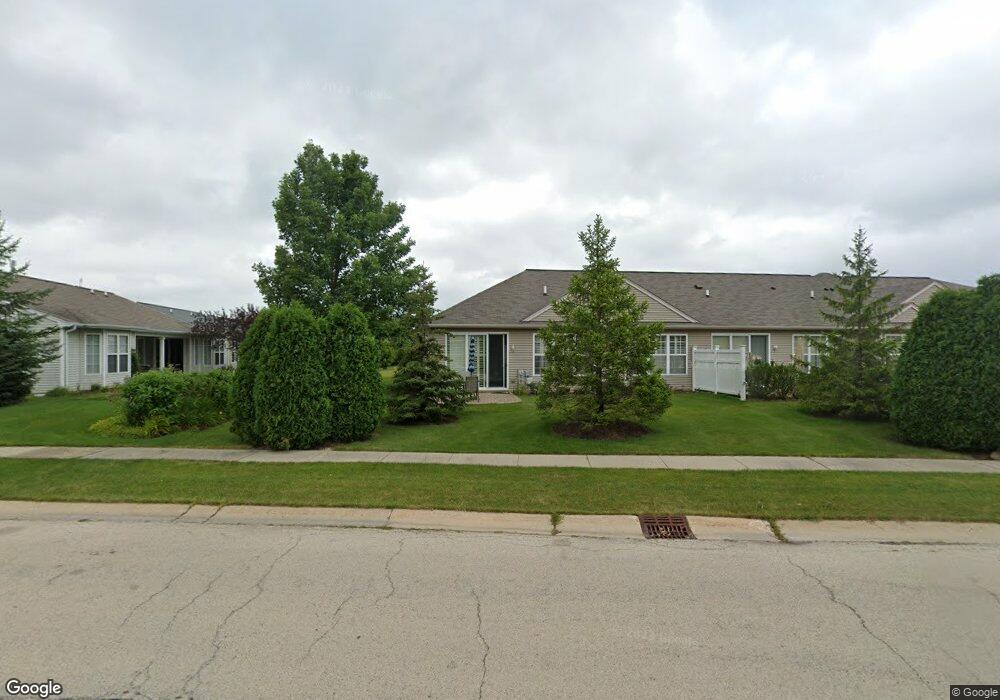
11325 Heatherdale Ln Unit SAME Huntley, IL 60142
Riley NeighborhoodEstimated Value: $334,281 - $401,000
2
Beds
2
Baths
1,550
Sq Ft
$229/Sq Ft
Est. Value
About This Home
This home is located at 11325 Heatherdale Ln Unit SAME, Huntley, IL 60142 and is currently estimated at $355,070, approximately $229 per square foot. 11325 Heatherdale Ln Unit SAME is a home located in McHenry County with nearby schools including Leggee Elementary School, Heineman Middle School, and Huntley High School.
Ownership History
Date
Name
Owned For
Owner Type
Purchase Details
Closed on
Nov 20, 2020
Sold by
Bigolin Wayne L and Wayne L Bigolin Trust
Bought by
Sun City Real Estate Llc
Current Estimated Value
Purchase Details
Closed on
Sep 22, 2016
Sold by
Bigolin Wayne L
Bought by
Bigolin Wayne L and Wayne L Bigolin Trust
Purchase Details
Closed on
Oct 3, 2010
Sold by
Locascio Salvatore and Locascio Linda
Bought by
Bigolin Wayne L
Purchase Details
Closed on
Aug 13, 2009
Sold by
Locascio Salvatore and Locascio Linda
Bought by
Locascio Salvatore and Locascio Linda
Purchase Details
Closed on
Jul 10, 2009
Sold by
Turk Pattl Renee
Bought by
Locascio Salvatore and Locascio Linda
Purchase Details
Closed on
Apr 22, 2005
Sold by
Norton Mary
Bought by
Norton Mary I
Purchase Details
Closed on
Dec 11, 2003
Sold by
Del Webb Communities Of Illinois Inc
Bought by
Norton Mary
Create a Home Valuation Report for This Property
The Home Valuation Report is an in-depth analysis detailing your home's value as well as a comparison with similar homes in the area
Home Values in the Area
Average Home Value in this Area
Purchase History
| Date | Buyer | Sale Price | Title Company |
|---|---|---|---|
| Sun City Real Estate Llc | -- | Attorney | |
| Bigolin Wayne L | -- | None Available | |
| Bigolin Wayne L | $80,000 | Fnt | |
| Locascio Salvatore | $92,500 | None Available | |
| Locascio Salvatore | $185,000 | Ticor Title Insurance Compan | |
| Norton Mary I | -- | -- | |
| Norton Mary | $180,182 | Fa |
Source: Public Records
Tax History Compared to Growth
Tax History
| Year | Tax Paid | Tax Assessment Tax Assessment Total Assessment is a certain percentage of the fair market value that is determined by local assessors to be the total taxable value of land and additions on the property. | Land | Improvement |
|---|---|---|---|---|
| 2024 | $5,950 | $83,781 | $5,589 | $78,192 |
| 2023 | $5,826 | $75,262 | $5,021 | $70,241 |
| 2022 | $5,484 | $68,532 | $4,572 | $63,960 |
| 2021 | $5,338 | $64,543 | $4,306 | $60,237 |
| 2020 | $5,258 | $62,822 | $4,191 | $58,631 |
| 2019 | $5,143 | $61,218 | $4,084 | $57,134 |
| 2018 | $5,402 | $63,467 | $4,596 | $58,871 |
| 2017 | $5,315 | $59,812 | $4,331 | $55,481 |
| 2016 | $5,385 | $56,867 | $4,118 | $52,749 |
| 2013 | -- | $53,135 | $9,426 | $43,709 |
Source: Public Records
Map
Nearby Homes
- 13012 Summerview Dr
- 11492 Stonewater Crossing
- 12961 Bull Ridge Dr
- 11565 Richmond Ln
- 12484 Carver Ln
- 12464 Carver Ln
- 11651 Fitzgerald Ln
- 13191 Stratford Ln
- 13221 Stratford Ln
- 11723 Evergreen Ln
- 0 SW Ruth and Main Rd Unit 7439226
- 10959 Route 47 Hwy
- IL Rt 47 & Mill St
- LOT 3 Il rt 47 Hwy
- LOT 2 Il Rt 47 & Joan Hwy
- Lot 30 Ryann Rd
- Lot 1 Il rt 47 Hwy
- 15218 Harmony Lot 2 Rd
- 10216 Ellery Ln
- 13568 Delaney Rd
- 11325 Heatherdale Ln
- 11325 Heatherdale Ln Unit 11325
- 11323 Heatherdale Ln
- 11328 Maplewood Ave
- 11321 Heatherdale Ln
- 11308 Maplewood Ave
- 11305 Heatherdale Ln
- 11303 Heatherdale Ln
- 11301 Heatherdale Ln
- 11385 Stonewater Crossing
- 11278 Maplewood Ave
- 11387 Stonewater Crossing
- 12907 Norfolk Dr
- 12912 Norfolk Dr
- 11383 Stonewater Crossing
- 11389 Stonewater Crossing
- 11285 Heatherdale Ln
- 11285 Heatherdale Ln
- 11285 Heatherdale Ln
- 11285 Heatherdale Ln