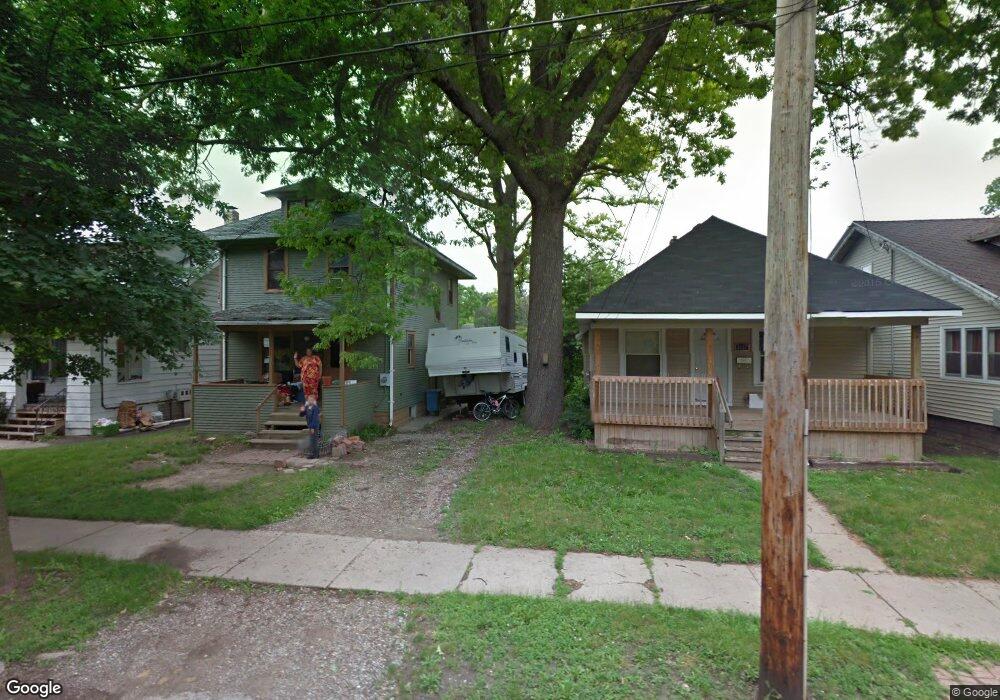
1133 E Malcolm x St Lansing, MI 48912
Holmes Street Area NeighborhoodEstimated Value: $98,000 - $127,278
3
Beds
1
Bath
1,600
Sq Ft
$71/Sq Ft
Est. Value
About This Home
This home is located at 1133 E Malcolm x St, Lansing, MI 48912 and is currently estimated at $113,570, approximately $70 per square foot. 1133 E Malcolm x St is a home located in Ingham County with nearby schools including Lyons Elementary School, Pattengill Academy, and Eastern High School.
Ownership History
Date
Name
Owned For
Owner Type
Purchase Details
Closed on
Aug 2, 2024
Sold by
Krohn John and Krohn Richard Nicholas
Bought by
Kuklovic Margaret Ruth
Current Estimated Value
Purchase Details
Closed on
Aug 1, 2024
Sold by
Gleason S Joy
Bought by
Krohn John and Krohn Richard Nicholas
Purchase Details
Closed on
Apr 18, 2011
Sold by
Deutsche Bank National Trust Company
Bought by
Gleason S Joy
Purchase Details
Closed on
May 13, 2010
Sold by
Torka Aaron V and Torka Kelly D
Bought by
Deutsche Bank National Trust Company
Purchase Details
Closed on
Jun 17, 2004
Sold by
Torka Bob H and Torka Willow S
Bought by
Torka Aaron V and Torka Kelly D
Home Financials for this Owner
Home Financials are based on the most recent Mortgage that was taken out on this home.
Original Mortgage
$60,000
Interest Rate
6.1%
Mortgage Type
Purchase Money Mortgage
Purchase Details
Closed on
Aug 18, 1998
Sold by
Torka Bob H and Torka Willow S
Bought by
Torka Aaron and Torka Kelly D
Purchase Details
Closed on
Jun 26, 1985
Sold by
Keener Tamara
Bought by
Torka Bob H and Torka Willow S
Create a Home Valuation Report for This Property
The Home Valuation Report is an in-depth analysis detailing your home's value as well as a comparison with similar homes in the area
Home Values in the Area
Average Home Value in this Area
Purchase History
| Date | Buyer | Sale Price | Title Company |
|---|---|---|---|
| Kuklovic Margaret Ruth | $119,900 | Liberty Title | |
| Krohn John | $40,000 | Liberty Title | |
| Gleason S Joy | $9,000 | None Available | |
| Deutsche Bank National Trust Company | $34,425 | None Available | |
| Torka Aaron V | $28,800 | Devon Title | |
| Torka Bob H | $21,500 | Devon Title | |
| Torka Aaron | $28,800 | -- | |
| Torka Bob H | $21,500 | -- |
Source: Public Records
Mortgage History
| Date | Status | Borrower | Loan Amount |
|---|---|---|---|
| Previous Owner | Torka Aaron V | $60,000 |
Source: Public Records
Tax History
| Year | Tax Paid | Tax Assessment Tax Assessment Total Assessment is a certain percentage of the fair market value that is determined by local assessors to be the total taxable value of land and additions on the property. | Land | Improvement |
|---|---|---|---|---|
| 2025 | $5,041 | $56,100 | $3,100 | $53,000 |
| 2024 | $39 | $43,700 | $3,100 | $40,600 |
| 2023 | $4,082 | $37,800 | $3,100 | $34,700 |
| 2022 | $2,233 | $33,800 | $2,600 | $31,200 |
| 2021 | $1,724 | $31,100 | $2,800 | $28,300 |
| 2020 | $1,713 | $29,700 | $2,800 | $26,900 |
| 2019 | $2,550 | $28,000 | $2,800 | $25,200 |
| 2018 | $1,539 | $26,100 | $2,800 | $23,300 |
| 2017 | $1,473 | $26,100 | $2,800 | $23,300 |
| 2016 | $2,460 | $25,600 | $2,800 | $22,800 |
| 2015 | $2,460 | $24,800 | $5,577 | $19,223 |
| 2014 | $2,460 | $24,800 | $4,498 | $20,302 |
Source: Public Records
Map
Nearby Homes
- 1201 Climax St
- 1024 E Malcolm x St
- 1128 Hickory St
- 1116 Hickory St
- 1100 Hickory St
- 1001 Raider St
- 1019 Dakin St
- 1134 S Holmes St
- 523 Clifford St
- 509 Clifford St
- 316 Jones St
- 314 S Bingham St
- 917 E Kalamazoo St
- 911 E Kalamazoo St
- 400 Lathrop St
- 302 S 8th St
- 1024 Eureka St
- 619 Shepard St
- 607 Shepard St Unit 2
- 527 Beech St
- 1133 E Malcolm x St
- 1131 E Malcom X St
- 1131 E Malcolm x St
- 1137 E Malcolm x St
- 1137 E Malcolm x St
- 1201 E Malcolm x St
- 1127 E Malcolm x St
- 1205 E Malcolm x St
- 1125 E Malcolm x St
- 1132 E Malcolm x St
- 1207 E Malcolm x St
- 1205 E Main St
- 1200 E Main St
- 1213 E Main St
- 1126 E Main St
- 1132 E Malcolm x St
- 1130 E Malcolm x St
- 1136 E Malcolm x St
- 1210 E Main St
- 1200 E Malcolm x St
Your Personal Tour Guide
Ask me questions while you tour the home.