Estimated Value: $124,000 - $192,000
3
Beds
1
Bath
1,144
Sq Ft
$130/Sq Ft
Est. Value
About This Home
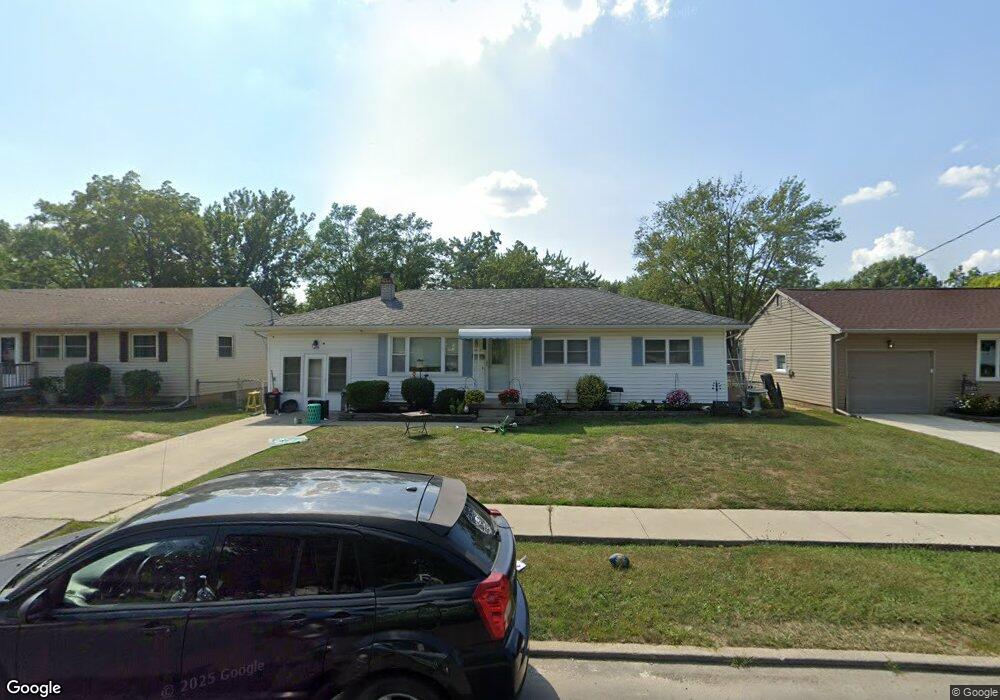
This home is located at 1133 Melrose St, Lima, OH 45801 and is currently estimated at $148,353, approximately $129 per square foot. 1133 Melrose St is a home located in Allen County with nearby schools including Heritage Elementary School, Lima North Middle School, and Lima West Middle School.
Ownership History
Date
Name
Owned For
Owner Type
Purchase Details
Closed on
Nov 29, 2016
Sold by
Bourk Britany and Bourk Brien
Bought by
Bourk Britany
Current Estimated Value
Home Financials for this Owner
Home Financials are based on the most recent Mortgage that was taken out on this home.
Original Mortgage
$80,274
Outstanding Balance
$64,029
Interest Rate
3.47%
Mortgage Type
New Conventional
Estimated Equity
$84,324
Purchase Details
Closed on
Nov 12, 2009
Sold by
Endicott Kelly S and Endicott Daniel S
Bought by
Lewis Britany
Home Financials for this Owner
Home Financials are based on the most recent Mortgage that was taken out on this home.
Original Mortgage
$87,387
Interest Rate
4.96%
Mortgage Type
FHA
Purchase Details
Closed on
Jul 1, 2009
Sold by
From Jackie and Estate Of Patricia M Miller
Bought by
Endicott Kelly S and Endicott Daniel S
Purchase Details
Closed on
Aug 23, 1985
Bought by
Miller Patricia M Braun
Create a Home Valuation Report for This Property
The Home Valuation Report is an in-depth analysis detailing your home's value as well as a comparison with similar homes in the area
Purchase History
| Date | Buyer | Sale Price | Title Company |
|---|---|---|---|
| Bourk Britany | -- | -- | |
| Lewis Britany | $89,000 | None Available | |
| Endicott Kelly S | $45,000 | Attorney | |
| Miller Patricia M Braun | -- | -- |
Source: Public Records
Mortgage History
| Date | Status | Borrower | Loan Amount |
|---|---|---|---|
| Open | Bourk Britany | $80,274 | |
| Previous Owner | Lewis Britany | $87,387 |
Source: Public Records
Tax History
| Year | Tax Paid | Tax Assessment Tax Assessment Total Assessment is a certain percentage of the fair market value that is determined by local assessors to be the total taxable value of land and additions on the property. | Land | Improvement |
|---|---|---|---|---|
| 2024 | $1,247 | $34,380 | $5,220 | $29,160 |
| 2023 | $987 | $23,250 | $3,540 | $19,710 |
| 2022 | $978 | $22,900 | $3,540 | $19,360 |
| 2021 | $1,034 | $22,900 | $3,540 | $19,360 |
| 2020 | $1,090 | $21,530 | $3,430 | $18,100 |
| 2019 | $1,090 | $21,530 | $3,430 | $18,100 |
| 2018 | $1,039 | $21,530 | $3,430 | $18,100 |
| 2017 | $1,008 | $19,710 | $3,430 | $16,280 |
| 2016 | $1,016 | $19,710 | $3,430 | $16,280 |
| 2015 | $1,038 | $19,710 | $3,430 | $16,280 |
| 2014 | $1,038 | $19,950 | $3,290 | $16,660 |
| 2013 | $1,010 | $19,950 | $3,290 | $16,660 |
Source: Public Records
Map
Nearby Homes
- 760 W O'Connor Ave
- 1015 N Cole St
- 0 Latham
- 635 W Ashton Ave
- 841 N Baxter St
- 645 W O'Connor Ave
- 638 Hazel Ave
- 949 Leland Ave
- 1164 Bahama Dr
- 631 Hazel Ave
- 816 N Baxter St
- 608 W O'Connor Ave
- 956 Rice Ave
- 1245 Latham Ave
- 576 W Ashton Ave
- 703 N Collett St
- 557 W Ashton Ave
- 934 N Metcalf St
- 1407 Latham Ave
- 618 Woodward Ave
Your Personal Tour Guide
Ask me questions while you tour the home.