Estimated Value: $171,000 - $229,227
Studio
--
Bath
1,044
Sq Ft
$198/Sq Ft
Est. Value
About This Home
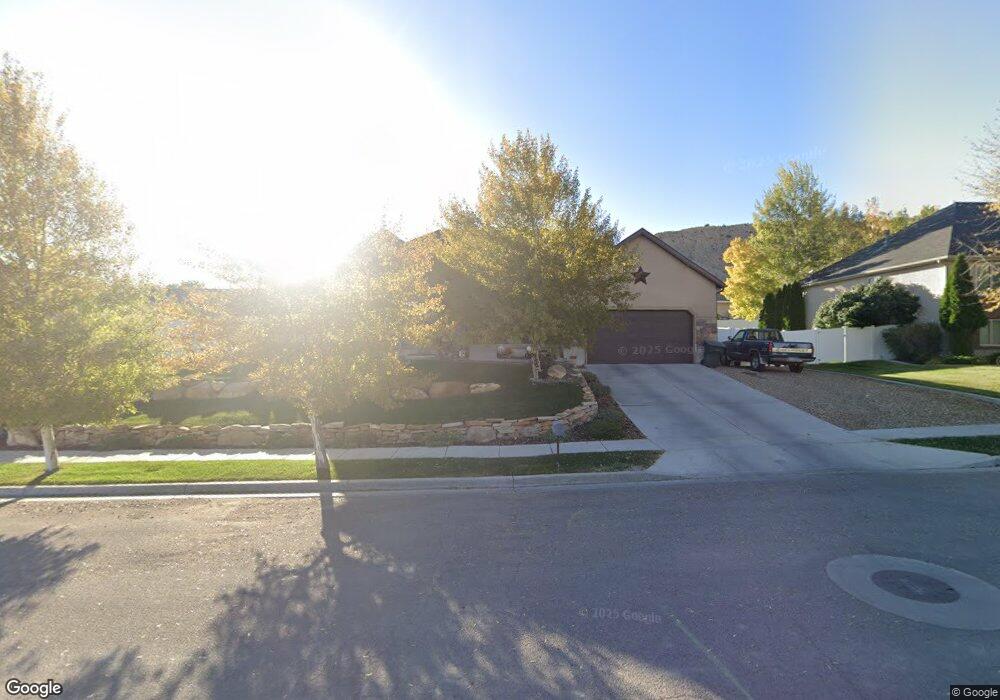
This home is located at 1133 N 300 E, Price, UT 84501 and is currently estimated at $206,807, approximately $198 per square foot. 1133 N 300 E is a home located in Carbon County with nearby schools including Castle Heights School, Mont Harmon Junior High School, and Carbon High School.
Ownership History
Date
Name
Owned For
Owner Type
Purchase Details
Closed on
Jun 8, 2017
Sold by
Winn Ralph and Madsen Vikki R
Bought by
Jeppson Nathan O
Current Estimated Value
Home Financials for this Owner
Home Financials are based on the most recent Mortgage that was taken out on this home.
Original Mortgage
$88,271
Outstanding Balance
$73,063
Interest Rate
3.93%
Mortgage Type
FHA
Estimated Equity
$133,744
Purchase Details
Closed on
Apr 9, 2009
Sold by
Winn Ralph M and Estate Of Mark Ralph Winn
Bought by
Winn Ralph M and Madsen Vikki R
Create a Home Valuation Report for This Property
The Home Valuation Report is an in-depth analysis detailing your home's value as well as a comparison with similar homes in the area
Purchase History
| Date | Buyer | Sale Price | Title Company |
|---|---|---|---|
| Jeppson Nathan O | -- | Professional Title Services | |
| Winn Ralph M | -- | None Available |
Source: Public Records
Mortgage History
| Date | Status | Borrower | Loan Amount |
|---|---|---|---|
| Open | Jeppson Nathan O | $88,271 |
Source: Public Records
Tax History
| Year | Tax Paid | Tax Assessment Tax Assessment Total Assessment is a certain percentage of the fair market value that is determined by local assessors to be the total taxable value of land and additions on the property. | Land | Improvement |
|---|---|---|---|---|
| 2025 | $716 | $58,918 | $9,544 | $49,374 |
| 2024 | $861 | $71,710 | $10,312 | $61,398 |
| 2023 | $1,004 | $89,159 | $8,432 | $80,727 |
| 2022 | $1,049 | $83,525 | $7,010 | $76,515 |
| 2021 | $902 | $111,520 | $10,710 | $100,810 |
| 2020 | $885 | $54,916 | $0 | $0 |
| 2019 | $788 | $51,256 | $0 | $0 |
| 2018 | $847 | $56,212 | $0 | $0 |
| 2017 | $837 | $56,212 | $0 | $0 |
| 2016 | $755 | $56,212 | $0 | $0 |
| 2015 | $755 | $56,212 | $0 | $0 |
| 2014 | $749 | $56,212 | $0 | $0 |
| 2013 | $559 | $41,550 | $0 | $0 |
Source: Public Records
Map
Nearby Homes