Estimated Value: $498,000 - $551,000
3
Beds
3
Baths
1,858
Sq Ft
$285/Sq Ft
Est. Value
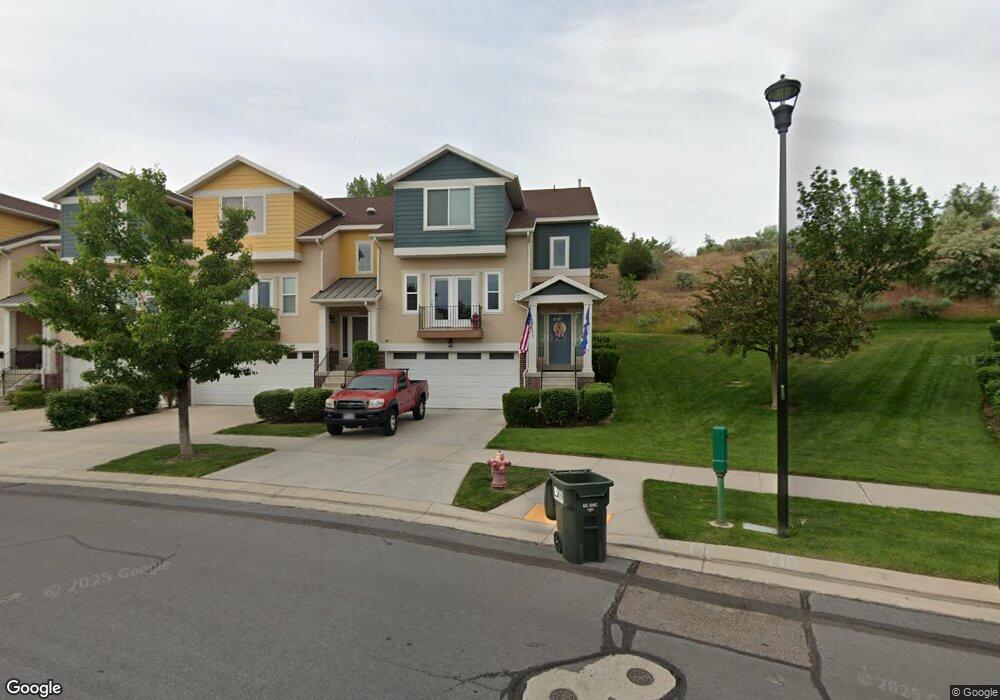
About This Home
This home is located at 1133 Quarry View Way, Sandy, UT 84094 and is currently estimated at $529,256, approximately $284 per square foot. 1133 Quarry View Way is a home located in Salt Lake County with nearby schools including Union Middle School, Hillcrest High School, and The Waterford School.
Ownership History
Date
Name
Owned For
Owner Type
Purchase Details
Closed on
Apr 22, 2020
Sold by
House Natalie and House Aleksander
Bought by
House Aleksander A and House Natalie J
Current Estimated Value
Purchase Details
Closed on
Jul 28, 2017
Sold by
Blair Richard F
Bought by
House Natalie and House Aleksander
Home Financials for this Owner
Home Financials are based on the most recent Mortgage that was taken out on this home.
Original Mortgage
$309,294
Outstanding Balance
$257,733
Interest Rate
3.91%
Mortgage Type
FHA
Estimated Equity
$271,523
Purchase Details
Closed on
Oct 18, 2007
Sold by
Pebblebrook Development Corp
Bought by
Blair Richard F
Home Financials for this Owner
Home Financials are based on the most recent Mortgage that was taken out on this home.
Original Mortgage
$253,400
Interest Rate
6.42%
Mortgage Type
Purchase Money Mortgage
Create a Home Valuation Report for This Property
The Home Valuation Report is an in-depth analysis detailing your home's value as well as a comparison with similar homes in the area
Home Values in the Area
Average Home Value in this Area
Purchase History
| Date | Buyer | Sale Price | Title Company |
|---|---|---|---|
| House Aleksander A | -- | None Available | |
| House Natalie | -- | None Available | |
| Blair Richard F | -- | Meridian Title |
Source: Public Records
Mortgage History
| Date | Status | Borrower | Loan Amount |
|---|---|---|---|
| Open | House Natalie | $309,294 | |
| Previous Owner | Blair Richard F | $253,400 |
Source: Public Records
Tax History
| Year | Tax Paid | Tax Assessment Tax Assessment Total Assessment is a certain percentage of the fair market value that is determined by local assessors to be the total taxable value of land and additions on the property. | Land | Improvement |
|---|---|---|---|---|
| 2025 | $2,876 | $541,200 | $54,100 | $487,100 |
| 2024 | $2,876 | $531,900 | $50,700 | $481,200 |
| 2023 | $2,696 | $497,200 | $48,200 | $449,000 |
| 2022 | $2,733 | $492,400 | $47,300 | $445,100 |
| 2021 | $2,414 | $370,100 | $39,600 | $330,500 |
| 2020 | $2,339 | $338,200 | $39,600 | $298,600 |
| 2019 | $2,255 | $317,700 | $37,300 | $280,400 |
| 2016 | $2,034 | $275,600 | $88,400 | $187,200 |
Source: Public Records
Map
Nearby Homes
- 8935 Quarry Stone Way
- 8971 Valley Bend Ct
- 1138 E Quarry Stone Way
- 876 E Chariot Dr
- 8569 Round Stone Cove
- 8569 Round Stone Cove Unit 8
- 1242 Earl Way
- 9092 Enchanted Oak Ln
- 807 E Whisper Cove Rd
- 8492 Fayeway Dr
- 9218 S Laura Anne Way
- 8857 S Capella Way
- 1430 E 8685 S
- 8546 S 1330 E
- 8732 S Oakwood Park Cr
- 1482 Waters Ln
- 8722 S Oakwood Park Cir
- 8797 Green Way Unit 3
- 8729 S Leafwood Ln
- 8373 S 1100 E Unit 39
- 1129 Quarry View Way
- 1125 Quarry View Way
- 1125 E Quarry View Way
- 8927 S Quarry Stone Way
- 8927 Quarry Stone Way
- 1121 Quarry View Way
- 8931 S Quarry Stone Way
- 8931 Quarry Stone Way
- 1117 Quarry View Way
- 8935 S Quarry Stone Way
- 8933 Heights Dr
- 1113 Quarry View Way
- 8939 Heights Dr
- 1109 E Quarry View Way
- 8941 Quarry Stone Way
- 1109 Quarry View Way
- 8946 S Quarry Stone Way
- 8946 Quarry Stone Way
- 8945 Quarry Stone Way
- 1105 Quarry View Way
Your Personal Tour Guide
Ask me questions while you tour the home.