1133 Rader Run Bloomington, IL 61704
Estimated Value: $246,000 - $272,458
3
Beds
4
Baths
1,239
Sq Ft
$208/Sq Ft
Est. Value
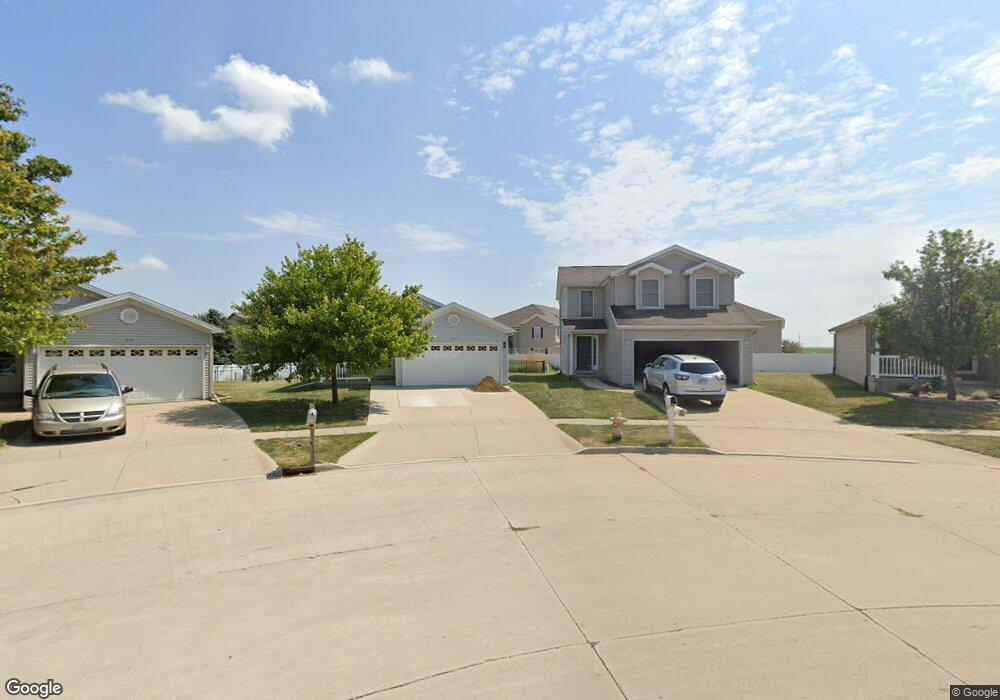
About This Home
This home is located at 1133 Rader Run, Bloomington, IL 61704 and is currently estimated at $257,865, approximately $208 per square foot. 1133 Rader Run is a home located in McLean County with nearby schools including Benjamin Elementary School, Evans Junior High School, and Normal Community High School.
Ownership History
Date
Name
Owned For
Owner Type
Purchase Details
Closed on
Sep 10, 2024
Sold by
Haworth Jason and Haworth Jennifer
Bought by
Haworth Jason and Haworth Jennifer
Current Estimated Value
Home Financials for this Owner
Home Financials are based on the most recent Mortgage that was taken out on this home.
Original Mortgage
$166,000
Outstanding Balance
$164,134
Interest Rate
6.47%
Mortgage Type
New Conventional
Estimated Equity
$93,731
Purchase Details
Closed on
Jun 23, 2009
Sold by
Secor Douglas and Secor Shauna
Bought by
Haworth Jason
Home Financials for this Owner
Home Financials are based on the most recent Mortgage that was taken out on this home.
Original Mortgage
$161,350
Interest Rate
4.86%
Purchase Details
Closed on
Jun 15, 2006
Sold by
Ried Michael S and Riedreid Melissa A
Bought by
Secor Douglas A and Secor Shauna R
Home Financials for this Owner
Home Financials are based on the most recent Mortgage that was taken out on this home.
Original Mortgage
$153,727
Interest Rate
6.72%
Create a Home Valuation Report for This Property
The Home Valuation Report is an in-depth analysis detailing your home's value as well as a comparison with similar homes in the area
Home Values in the Area
Average Home Value in this Area
Purchase History
| Date | Buyer | Sale Price | Title Company |
|---|---|---|---|
| Haworth Jason | -- | Mortgage Connect Lp | |
| Haworth Jason | $158,000 | None Available | |
| Secor Douglas A | $156,000 | None Available |
Source: Public Records
Mortgage History
| Date | Status | Borrower | Loan Amount |
|---|---|---|---|
| Open | Haworth Jason | $166,000 | |
| Previous Owner | Haworth Jason | $161,350 | |
| Previous Owner | Secor Douglas A | $153,727 |
Source: Public Records
Tax History Compared to Growth
Tax History
| Year | Tax Paid | Tax Assessment Tax Assessment Total Assessment is a certain percentage of the fair market value that is determined by local assessors to be the total taxable value of land and additions on the property. | Land | Improvement |
|---|---|---|---|---|
| 2024 | $4,408 | $75,041 | $20,270 | $54,771 |
| 2022 | $4,408 | $55,890 | $15,097 | $40,793 |
| 2021 | $4,038 | $51,165 | $13,821 | $37,344 |
| 2020 | $3,919 | $49,772 | $13,445 | $36,327 |
| 2019 | $3,718 | $48,925 | $13,216 | $35,709 |
| 2018 | $3,631 | $47,966 | $12,957 | $35,009 |
| 2017 | $3,484 | $47,966 | $12,957 | $35,009 |
| 2016 | $3,474 | $47,966 | $12,957 | $35,009 |
| 2015 | $3,482 | $48,052 | $12,980 | $35,072 |
| 2014 | $3,443 | $48,052 | $12,980 | $35,072 |
| 2013 | -- | $48,052 | $12,980 | $35,072 |
Source: Public Records
Map
Nearby Homes
- 1313 Woodbine Rd
- 1313 Inglewood Cir
- 1408 Woodbine Rd Unit 1
- 1410 Broad Creek Rd
- 35 Greythorne Cir
- 7 Melrose Ct
- 1 Windsong Way
- 1908 Crimson Ln
- 3211 Leafy Ln
- 24 Stonehouse Ct
- 1 Worthington Ct
- 1314 Nicki Dr
- 1206 Chatham Ln
- 1708 Royal Pointe Dr
- 2007 Withers Ln
- 2810 Stevenson Dr
- 2805 Stevenson Dr
- 418 Standish Dr
- 2719 Arrowhead Dr
- 10 Deerfield Ct
- 3514 Prescher Point
- 1131 Rader Run
- 3512 Prescher Point
- 1129 Rader Run
- 3621 Pamela Dr
- 1118 Ekstam Dr Unit 1877764-3639250
- 1118 Ekstam Dr Unit 1877764-5316424
- 1118 Ekstam Dr Unit 1877764-4802066
- 1118 Ekstam Dr Unit 1877764-4219157
- 1118 Ekstam Dr Unit 1877764-7723519
- 3623 Pamela Dr
- 3619 Pamela Dr
- 1127 Rader Run
- 3510 Prescher Point
- 3625 Pamela Dr
- 3617 Pamela Dr
- 1125 Rader Run
- 3508 Prescher Point
- 1128 Rader Run
- 1128 Rader Run